
351 Exchanges into ETFs: Pros, Cons, and the New IRS Guidance
Few planning tools solve as many problems at once as a 351 exchange. Investors sitting on highly appreciated stock have long faced a hard choice: hold an aging, hard-to-manage book of positions, or sell and hand a large share of the gains to the IRS. A 351 exchange offers a third path. Investors contribute those holdings in-kind to a newly launched ETF, receive ETF shares in return, and defer the capital gains tax, while gaining professional management, daily liquidity, and the ongoing tax efficiency of the ETF structure.
Done right, the process turns years of accumulated tax lots, direct-indexing sleeves, and legacy positions into a single, diversified holding. And after this week’s guidance, investors and advisors have something they lacked before: a written IRS standard for what a legitimate 351 launch looks like.
On September 28, 2026, the IRS began to draw a line in the sand on “potentially abusive” ETF tax strategies, 351 exchanges, and box spreads when they released Notice 2026-62 and Revenue Ruling 2026-20. The question is can you still do 351 exchanges? The answer is yes but only when the contributed securities fit the fund’s strategy and are meant to stay in the fund. That is the practical line Treasury and the IRS drew with their most recent notice.
The importance of these new pronouncements can’t be overstated as more than 100 ETFs have been launched via Section 351 since 2021, with over $20 billion in combined seed assets, according to InvestmentNews. In this article, we weigh the pros and cons of 351 exchanges in light of the new guidance and explain what this means for ETF investors.
Explaining 351 Exchanges:
A 351 exchange lets investors contribute appreciated securities to a new ETF in return for shares in that ETF, without having to recognize a gain on the transfer. The investor’s original cost basis carries over to the ETF shares, so tax is deferred until those shares are sold.
The Core Requirements For a 351 Exchange, per Advisor Perspectives:
| Requirement | Rule |
|---|---|
| Single-issuer cap | No one issuer can be above 25% of each investor’s contributed assets. |
| Top-five position cap | The five largest positions combined cannot exceed 50%. |
| Control | Contributors to the ETF must own at least 80% of shares immediately after contributing. |
| Timing | Available only at launch. Later inflows cannot use 351. |
What the New Guidance States
The guidance separates “seed and hold” 351 launches from “seed and swap” conversions, with the tax treatment of the former remaining unchanged while the latter is now taxable.
Revenue Ruling 2026-20 addresses a specific pattern: an investor contributes an appreciated portfolio to a new ETF, an authorized participant (AP) buys in with different securities or cash, and the ETF soon redeems the AP using the investor’s original assets. Applying the step-transaction doctrine and treating the ETF as a mere conduit, the IRS holds that the investor made a taxable Section 1001 exchange with the AP, not a Section 351 transfer. The fact that the redemption qualifies under the previously mentioned IRS section 852(b)(6) fails to rescue the plan.
Notice 2026-62 takes a wider view. It describes the 351 conversion pattern as combining Sections 351 and 852(b)(6) “to achieve a result that neither provision was designed to produce,” and also flags related tax strategies such as:
- Box spread funds that earn T-bill-like returns through options and redeem appreciated options in-kind, so holders avoid current ordinary income (the BOXX model).
- Partnership structures used to transfer undiversified stock into a 351 conversion.
- Funds that rotate between same-index ETFs around dividend record dates.
- Commodity and digital-asset ETFs that use in-kind redemptions to pass the Regulated Investment Companies (RIC) income test.
- Tax-aware long/short strategies using straddles, currency elections, and swap terminations.
We believe there are three main points investors should consider when weighing a 351 exchange:
The safe lane is explicit: Notice 2026-02 explicitlydoes not address a 351 transaction “used to seed a newly established ETF with assets that are consistent with the ETF’s investment thesis and that are intended and expected to be retained by the ETF absent a substantial change in circumstances (including an unexpected change in market or business conditions).”
Retroactivity is on the table: Any further guidance “could apply prospectively only or retroactively to transactions that already have taken place at the time the guidance is issued.”
Comments are due October 28, 2026: The Treasury Department is weighing the issuance of additional rules, so the line could still move.
Pros
The benefit of the updated guidance is it maintains the core benefit of a 351 exchange, thereby permitting investors to defer gains on a concentrated or unwieldy portfolio.
Other potential benefits include:
- Tax deferral on appreciated holdings: Investors can move into professional management without selling and paying capital gains tax up front. Basis carries over, so tax is only due when the ETF shares are sold.
- Ongoing ETF tax efficiency: Once inside, the ETF can use in-kind redemptions under IRS section 852(b)(6) to purge low basis lots over time. This typically limits capital gain distributions. Rev. Rul. 2026-20 leaves ordinary-course redemptions alone.
- Simplification: Hundreds of legacy lots, direct-indexing sleeves, or tax-loss-harvested accounts come under one ticker with daily liquidity and relatively simple reporting.
- Step-up planning: Because tax is deferred, not forgiven, shares held until death may receive a basis step-up.
- Clearer rules than a week ago: The IRS has now said in writing that retained contributions are outside its concern, which provides sponsors and advisors a defensible standard.
Cons and risks
The most significant new risk is recharacterization. This can happen when an ETF launch appears to be a “seed and swap,” which can result in an investor’s contribution being treated as a taxable sale. For example, contributions that are quickly redeemed out to an AP, leaving the ETF with a materially different portfolio, are taxable Section 1001 exchanges; the timing of “shortly thereafter” an ETF launch is a key red flag.
Other potential risks include:
- Possible retroactive guidance: The Treasury’s notice reserves the right to apply its position to previous launches, therefore, previous conversion-style launches carry open tax exposure until further guidance is issued.
- Less portfolio flexibility: The ETF should not have a pre-arranged plan to dispose of contributed assets beyond ordinary operations. A manager who wants to overhaul the book immediately after launch now invites scrutiny.
- Diversification is still required: Truly concentrated positions (one stock over 25%, or top five over 50%) cannot be contributed alone. The notice also targets partnership workarounds used to get satisfy this test.
- Deferral, not elimination: Carry over basis means the embedded gain is still there. Selling the ETF shares triggers the capital gain.
- One-time window and fund risk.:351 exchanges only work at launch. Investors necessarily take on a new ETF’s manager, fees, and the risk it fails to gather assets or later closes, which can force a taxable event.
- Cost and complexity: ETF launches need legal, tax, and operational work, and each investor’s contribution must be reviewed for eligibility.
Who it fits, and what to check
A 351 exchange makes the most sense for a long-term investor who holds a diversified and appreciated portfolio that is similar to the target ETF’s strategy.
| Profile | Fit after the guidance |
|---|---|
| Diversified, appreciated equities that match the ETF’s mandate and that the investor plans to hold | Strong, potentially in the safe lane |
| Direct-indexing or tax-loss-harvested accounts tracking a similar index | Reasonable, if holdings overlap the fund’s thesis |
| Portfolio that differs from the target ETF’s strategy and would be traded out soon after fund launch | Weak, the type of pattern that Rev. Rul. 2026-20 taxes |
| One or two concentrated stocks | Not eligible alone and partnership workarounds are flagged |
Before committing to a 351 exchange, investors and advisors should ask:
- Does the new ETF’s stated strategy match what I am contributing?
- Does the sponsor expect to keep most contributed positions, and how fast will it rebalance after launch?
- Are there prearranged AP trades or redemptions around the seeding date?
- Has tax counsel reviewed the launch against Rev. Rul. 2026-20?
- What happens to my position if the ETF closes at a later date?

About Strategy Shares
Strategy Shares is a family of exchange traded funds (ETFs) focused on bringing alternative strategies to the ETF marketplace. The firm strives to provide innovative strategies that support investors in meeting the challenges of an ever-changing global market environment. For more information on Strategy Shares and its various offerings, please visit: www.strategysharesetfs.com.
Retirement Income: The Misconceptions That Cost Retirees the Most
Building a nest egg and living off one are two different skills. Growth investing rewards patience through volatility. Income investing punishes it – a bad year doesn’t just show up on a statement, it cuts into money you’re actually spending. That difference is where most common misconceptions about retirement income take root.
Misconception #1: A high yield is “free” income
The most persistent myth about retirement income is that yield is simply a reward for owning a good asset. In reality, yield is compensation for a risk you’re taking on, and the risk isn’t always obvious. Sometimes it’s straightforward: longer-duration or lower-credit-quality bonds pay more because you’re locking up money longer or lending to shakier borrowers. Other times, the yield comes from giving something up entirely – most notably your upside. That’s exactly how covered call ETFs work.
Misconception #2: Owning several income funds means you’re diversified
A related myth is that stacking multiple income-generating positions automatically spreads out risk. But holdings that all react to the same economic force (say, interest rates) aren’t diversified just because they have different names. Real diversification means owning products that behave differently from each other, so when one zigs, another zags. A classic example: real estate and utility funds are both popular for their attractive dividends, but both sectors are highly sensitive to interest rates and tend to move together, so pairing them provides far less cushioning than it appears to be on paper.
This matters just as much when comparing entire fund strategies. In this piece, we’d like to present a look at three different funds: JEPI, HNDL, and SCHD. They each offer three very different approaches to retirement income.1
The Covered Call Trade: What JEPI Actually Gives You (and Takes Away)
The JPMorgan Equity Premium Income ETF (JEPI) is the largest fund of its kind, holding defensive, lower-volatility stocks while layering on income from equity-linked notes tied to the S&P 500. 2
The tradeoff shows up in bull markets. Because the strategy sells away the right to the market’s biggest gains in exchange for premium income, JEPI has historically lagged the S&P 500 by a wide margin over multi-year stretches, and in 2026’s strong rally its total return has trailed noticeably even after counting distributions. There’s also a tax wrinkle: income from equity-linked notes is generally taxed as ordinary income rather than at qualified dividend rates, which matters outside an IRA.
None of this makes JEPI a bad product – it does what it’s designed to do. The mistake is treating the 8% yield as “extra” return, rather than income harvested by trading away growth, which is a real cost over a retirement that could stretch 25 to 30 years.
HNDL: Income Without Giving Up the Upside
HNDL (the Strategy Shares Nasdaq 7HANDL Index ETF) was built to solve the income problem without making that trade. Rather than selling away upside for premium, it is a fund-of-funds built around a core stock/bond allocation paired with a tactically managed “explore” sleeve of income-oriented ETFs, using modest leverage to target an approximately 7% annualized distribution paid monthly. The distinction matters: because HNDL writes no options against an index, none of its upside is sold off. It stays fully invested across equities, fixed income and alternative assets, each of which can contribute to growth as well as income. A retiree collecting roughly 7% from HNDL is not paying for that income by forfeiting participation in the next rally.
We believe that structure is also far closer to genuine diversification. Rather than stacking income sources that all lean on the same risk — the rate-sensitive REIT-and-utility pairing described above — HNDL’s blend is explicitly engineered to spread exposure across asset classes that do not move together. It is diversification by design rather than by label. The Fund has paid its monthly distribution at the 7% target without interruption since its 2018 launch, through the 2020 crash, the 2022 drawdown in both stocks and bonds, and the recovery that followed — an eight-year record of uninterrupted monthly income that few income strategies of any structure can claim. It also trades on an exchange every business day, at a published price, with none of the gates, queues or redemption limits that come with a private REIT or an interval fund. For a retiree who needs the money to arrive on schedule and needs access to the principal, that combination of consistency and daily liquidity is the point.
The tradeoff worth knowing: the leverage and multi-layered structure add expense relative to a plain index fund, and they can make HNDL more sensitive to how its underlying holdings behave in a sharp, correlated downturn. That is a fair question to put to any diversified strategy, and it is one HNDL has now been asked in live markets more than once.
SCHD: The Lower-Yield, Higher-Growth Alternative
If JEPI and HNDL both engineer a higher current yield through options or leverage, the Schwab U.S. Dividend Equity ETF (SCHD) takes the opposite path: it simply owns quality dividend-paying businesses and lets the yield be whatever those companies naturally pay. SCHD screens U.S. companies with at least a decade of consistent dividends, then ranks them on financial strength, profitability, and dividend growth rather than raw yield, landing on roughly 100 established payers, rebalanced quarterly with an annual reconstitution.
The headline yield is modest by comparison (a little over 3%, well below JEPI’s roughly 8% or HNDL’s roughly 7% target). But that lower yield comes with real advantages. Because SCHD isn’t giving up upside through options or adding leverage, it fully participates in market gains, and in 2026’s rally it has actually outperformed the S&P 500 on a total-return basis. Its dividend has also grown at a healthy mid-to-high single-digit annual clip over the past five years, which matters over a multi-decade retirement where a fixed dollar amount steadily loses purchasing power to inflation. Its distributions are largely qualified dividends taxed at lower rates than ordinary income, its expense ratio is a fraction of a percent, and it trades on an exchange every business day with no lockups.
The tradeoff is the flip side of its strength: a 3% yield generates meaningfully less current income than JEPI or HNDL from a same-size portfolio, so a retiree relying heavily on portfolio income for near-term expenses may find SCHD alone doesn’t produce enough cash flow. It’s also concentrated in a value-and-dividend style that can lag a rally led by sectors it screens out.
Putting the Three Side by Side
The three funds sit at different points on the same spectrum. JEPI maximizes current income by selling away equity upside. SCHD minimizes engineered yield in favor of full market participation and dividend growth — less current income, but a stronger long-term growth engine. HNDL sits between the two by design, and arguably gets the most from both ends: it targets a yield close to JEPI’s roughly 8% while, like SCHD, keeping its upside intact, because it engineers that income through multi-asset diversification and modest leverage rather than by selling options. The cost is complexity and expense rather than forfeited growth. A portfolio built entirely around the highest yielder of the three is likely trading away more long-term purchasing power than it realizes.
What This Means in Practice
None of these three funds is inherently “wrong”, but none should be evaluated on yield alone. Before committing retirement dollars to any income fund, it’s worth asking:
- What’s the total return, not just the yield? A high distribution paired with price erosion can leave you worse off than a lower-yielding fund that participates in growth.
- Does it give up upside, keep all the downside, or both?
- Is the diversification real, or are the holdings all exposed to the same risk?
- How did it perform in genuinely different market environments – a sharp crash and a slow, grinding decline?
No single fund – covered call, leveraged multi-asset, or straightforward dividend growth – solves every part of the problem on its own. JEPI, HNDL, and SCHD each answer a different question: how much can I collect right now, how do I get meaningful income without giving up growth entirely, and how do I make sure my income keeps growing over a 30-year horizon. The goal isn’t the highest number on the yield line; it’s a mix that can keep paying you, and keep pace with the cost of living, through both good markets and bad ones.
Before you add or keep any income fund in your retirement portfolio, pull up its total return next to its yield, run it through the questions above, and see how it actually held up in 2020 and 2022. If you’re not sure how a specific fund stacks up, or how to blend a few of these approaches into one portfolio, that’s a conversation worth having with a financial advisor who can look at your full picture.
| Fund | Objective | Asset Class | Gross Expense Ratio | NAV (as of 8/4/26) | Inception | 30-Day SEC Yield (as of June 30) | Fund Risks |
|---|---|---|---|---|---|---|---|
| JEPI | Seeks to deliver monthly distributable income and equity market exposure with less volatility. | U.S. Equity | 0.35% | $57.39 | 5/20/2020 | 8.20% | click here |
| HNDL | Seeks investment results that correspond generally, before fees and expenses, to the price and yield performance of the Nasdaq 7HANDL™ Index. | Fixed Income/ Equities/ and Alternatives | 0.95% | $22.79 | 1/16/2018 | 2.54% | click here |
| SCHD | Seeks to track as closely as possible, before fees and expenses, the total return of the Dow Jones U.S. Dividend 100™ Index. | U.S. Equity | 0.06% | $33.94 | 10/20/2011 | 3.35% | click here |
1 The performance quoted represents past performance and does not guarantee future results. Investment return and principal value of an investment will fluctuate so that an investor’s shares, when sold or redeemed, may be worth more or less than the original cost. Current performance may be lower or higher than the performance quoted. Performance data current to the most recent month end may be obtained by calling 855-HSS-ETFS or visiting StrategySharesETFs.com. For HNDL standardized performance, click here. For JEPI standardized performance, click here. For SCHD standardized performance, click here. ↩
2 As of mid-2026 it’s paying a trailing distribution yield in the roughly 8% range on a steady monthly schedule – a big part of its appeal for retirees who want a predictable check. ↩
About Strategy Shares
Strategy Shares is a family of exchange traded funds (ETFs) focused on bringing alternative strategies to the ETF marketplace. The firm strives to provide innovative strategies that support investors in meeting the challenges of an ever-changing global market environment. For more information on Strategy Shares and its various offerings, please visit: www.strategysharesetfs.com.
Strategy Shares Announces Edward Rosenberg as Head of ETFs
(July 20, 2026) – Strategy Shares, a provider of alternative investment solutions, announced Edward Rosenberg as Head of ETFs, effective today. Mr. Rosenberg joins Strategy Shares from Russell Investments, where he was most recently the Head of ETF Products & Capital Markets.
In this newly created role, Mr. Rosenberg will lead Strategy Shares’ ETF growth initiatives, broaden awareness of the firm’s current lineup of four ETFs, and help guide the firm’s expansion as it prepares to launch additional investment strategies.
Prior to joining Strategy Shares, Mr. Rosenberg held senior ETF leadership roles at Russell Investments, Texas Capital Bank, American Century Investments, Northern Trust, and The Vanguard Group, with 25 years of experience in the industry. Mr. Rosenberg has a Business Administration Degree from Muhlenberg College and earned an MBA from Pennsylvania State University. He is a frequent guest on Bloomberg TV, CNBC, and Fox Business, and has been quoted in 350+ financial media outlets. Mr. Rosenberg is also a regular speaker at Inside ETFs and other major global conferences.
“I am excited to join a firm whose focus is on innovative investment solutions designed to enhance investors’ portfolios,” Mr. Rosenberg said. “I look forward to helping drive the growth of Strategy Shares as investors continue to turn to ETFs with diversification benefits to navigate an increasingly uncertain market environment.”
Strategy Shares offers differentiated ETF strategies designed to provide investors with alternative approaches to portfolio construction and is affiliated with Catalyst Funds and Rational Funds. Strategy Shares manages approximately $772 million in assets under management (AUM) as of June 30, 2026, with its affiliated companies totaling nearly $15 billion in AUM.
For more information, please visit www.strategysharesetfs.com.
For media inquiries on this announcement, please contact Deborah Kostroun of Zito Partners at 201-403-8185.
About Strategy Shares
Strategy Shares is a family of exchange traded funds (ETFs) focused on bringing alternative strategies to the ETF marketplace. The firm strives to provide innovative strategies that support investors in meeting the challenges of an ever-changing global market environment. For more information on Strategy Shares and its various offerings, please visit: www.strategysharesetfs.com.
The Eroding Dollar: Why Advisors Need a New Playbook for Client Portfolios
For decades, financial advisors have told clients that careful diversification, patience, and discipline are keys to retiring securely. Money once meant safety. Bonds once meant income stability – the foundation of retirement income. Today, that bedrock is cracking under the weight of inflation and a dollar in decline. A primary source of retirement income – bond portfolios – have generated negative returns after inflation over the past decade. No wonder many clients don’t feel better off. The problem is that almost every investment plan begins with the same assumption: the U.S. dollar, the world’s reserve currency, holds its worth.
A Decade of Negative Real Returns: Bonds Have Failed to Protect Purchasing Power1
Nominal returns disguise real losses once inflation is accounted for.

1 Bloomberg LP. Bond portfolios represented by the Bloomberg U.S. Aggregate Bond TR Index, which is a broad-based fixed income index that represents the overall performance of the U.S. investment grade bond market, including U.S. Treasurys, corporate bonds, mortgage-backed securities, and asset-backed securities (excluding high yield or “junk” bonds). Cumulative Inflation represented by the Consumer Price Index, which is a measure of the average change over time in the prices paid by urban consumers for a market basket of consumer goods and services. Data from 09/30/15 to 09/30/25. September 2025 CPI based on Bloomberg survey of economists.
Fiscal Policy’s Breaking Point
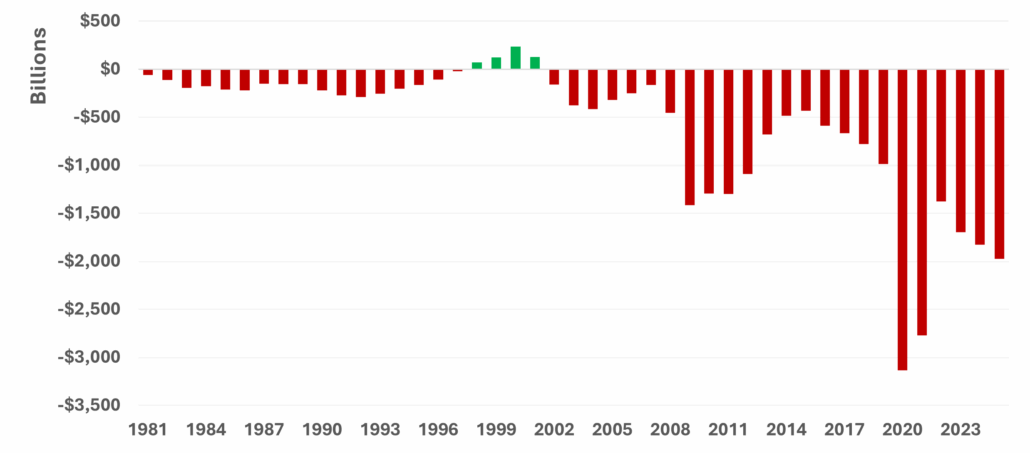
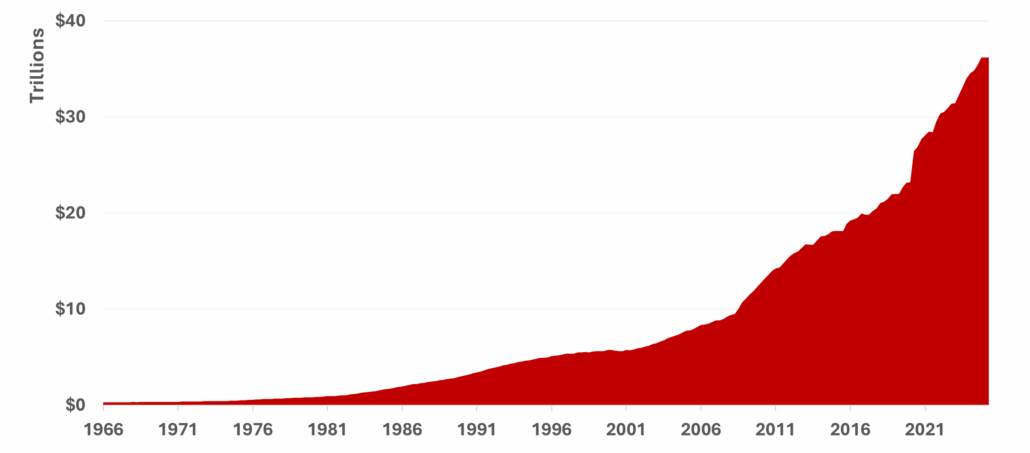
Deficits aren’t new, but trillion-dollar shortfalls are now an annual occurrence, driving a debt trajectory without precedent. For advisors, this isn’t abstract policy, it’s the silent force undermining every client’s real return.
The U.S. Government Budget Deficit Has Become a Perpetual Crisis2
Trillion-dollar shortfalls have become a seemingly permanent feature of fiscal policy.
National Debt Has Grown Exponentially, Outpacing Economic Reality3
Growth in the national debt now exceeds the nation’s productive capacity
2U.S. federal deficit or surplus. U.S. Department of Treasury. Federal Reserve Economic Data. Based on monthly data through September 2025.
3Department of Treasury. Debt held by the public. Based on quarterly data through April 2025.
The Uncomfortable Truth: Washington’s Easiest Path Forward is Devaluation
Why are financial advisors finding a disconnect between market performance and client experience? Grocery bills are up +20%4, and “safe” instruments like CDs are paying far less than that. Even traditional investments, like bonds, are down after inflation. Clients can feel the math – and they’re right. The dollar simply buys less.
The purchasing power of the dollar is declining. The long-term chart of the dollar’s purchasing power dating back to 1973 shows a significant decline. What once bought a cart of groceries in 1973 could barely buy a bag of groceries today. A dollar is worth just 13 cents of what it used to be.
Decades of excessive spending by the federal government and easy monetary policy by the Federal Reserve have flooded the economy with dollars faster than it can produce goods and services, diluting purchasing power and feeding inflation.
How do you service $1 trillion in debt when there’s no fiscal room left? Simple, you print more money and continue to devalue the dollar. Inflation has already erased a decade of real bond returns. Fiscal devaluation isn’t a failure, it’s the plan.
When policy rewards spending over saving, the dollar itself becomes the casualty.
By the numbers
A system built to spend money, not save.
Every U.S. Dollar Printed Buys Less6
The money supply has risen nearly 200% since 2008. A growing supply of dollars chases the same goods: the recipe for inflation.5
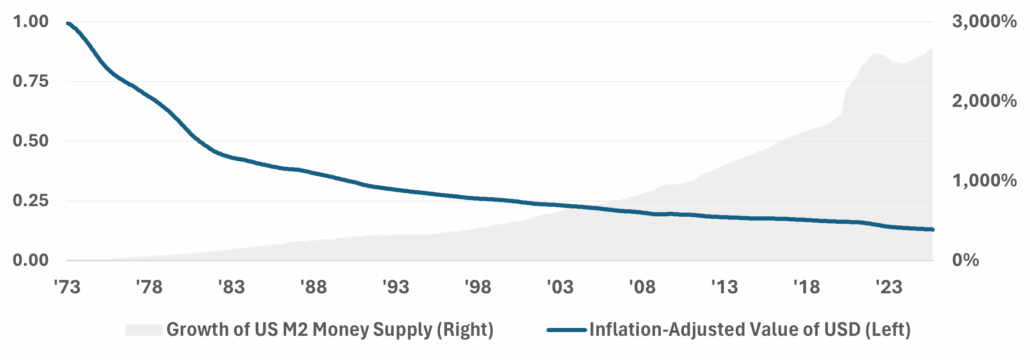
4Source: U.S. Bureau of Labor Statistics. Data for 2025 compared to 2020.
5M2 money supply is a measure of money circulation that includes total dollars in cash deposits and other deposits readily convertible to cash, such as money market funds.
6Bloomberg LP. Board of Governors of the Federal Reserve. OECD. September 2025.
7U.S. Department of Treasury. September 2025.
Washington Spent $1.78 Trillion More Than It Earned in 2025 – Again8
When spending outpaces revenue this dramatically, inflation becomes policy.

De-Dollarization Isn’t Rebellion, It’s Recognition
What Washington treats as a domestic problem, the rest of the world now treats as a risk to avoid. The rest of the world is acting on what Washington refuses to admit. Amid rising U.S. debt and persistent geopolitical tensions, central banks have quietly reduced their U.S. dollar exposure, putting further downward pressure on the dollar’s value. For the first time in a generation, global reserve managers are voting with their reserves, and not with the dollar.
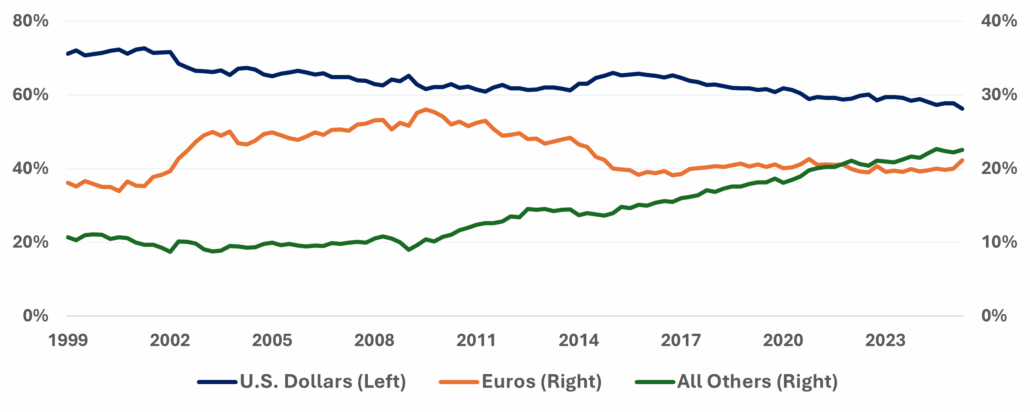
- The U.S. dollar’s share of global reserves has dropped from 71% in 1999 to 56% today.
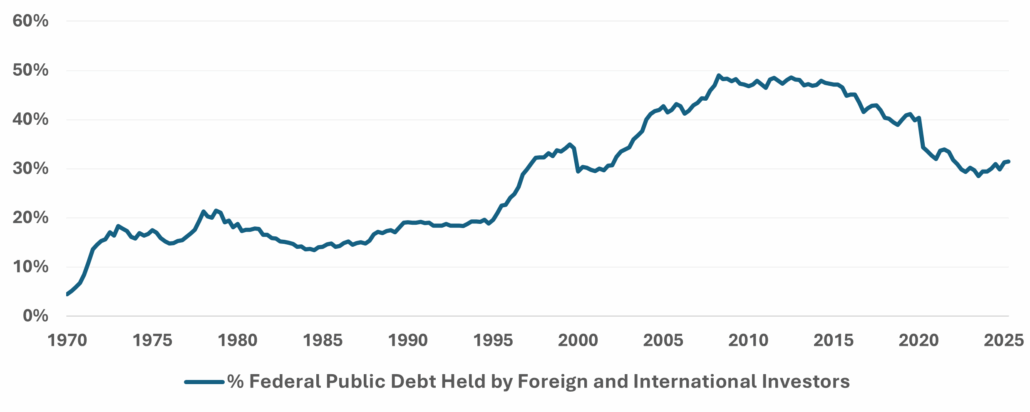
- Foreign holdings of U.S. debt have dropped by almost a third.
Fiscal devaluation isn’t a failure. It’s the plan.
U.S. Dollar as a % of FX Reserves: Global Confidence in the Dollar Is Fading9
The dollar’s share of global reserves has fallen from 71% in 1999 to 56% today.
8U.S. Department of Treasury. September 2025.
9Bloomberg LP. IMF COFER. June 2025.
Foreign Investors Are Turning Away from U.S. Debt, and That’s Not Good For the Dollar10
Foreign ownership of U.S. debt has dropped from nearly 50% to just over 30% since 2008.
Gold: The Asset That Doesn’t Lie
In the 1970s, gold soared as the dollar broke from its anchor.11 Today, central banks are restoring that anchor, not for nostalgia, but necessity. Nations around the world are making record purchases of gold. It’s driven by math as much as by geopolitics. Nations are essentially hedging against policy failure.
- From March 2013 to March 2022, global central banks made net gold purchases of 126 metric tons per quarter, on average.
- From June 2022 to September 2025, these net purchases increased to an average of 269 metric tons per quarter.
A Global Shift: Central Banks Double Gold Buying Since 202212
The world’s monetary authorities are trading paper promises for a tangible store of value in gold.

10U.S. Department of Treasury. April 2025.
11Prior to 1971, the U.S. dollar was backed, at least in part, by gold reserves (commonly referred to as the “gold standard”). In 1971, the U.S. switched to a fiat monetary system, effectively ending the “gold standard.” Fiat money has no value of its own and is not backed by gold; rather, its value is derived from the trust and stability of the government that issues it.
12Bloomberg LP. Quarterly demand (net purchase) data. September 2025.
Global confidence in the dollar is fading — not suddenly, but steadily.
The desire for gold should come as no surprise. When looking at a chart since 1973 – the decade the dollar and gold parted ways – the value of gold has increased more than 60x (and almost 8x when adjusting for inflation). Half a century of data confirms gold’s role as a long-term store of value against monetary decay.
Fifty Years, One Story: Gold Preserved Value as the Dollar Lost It13
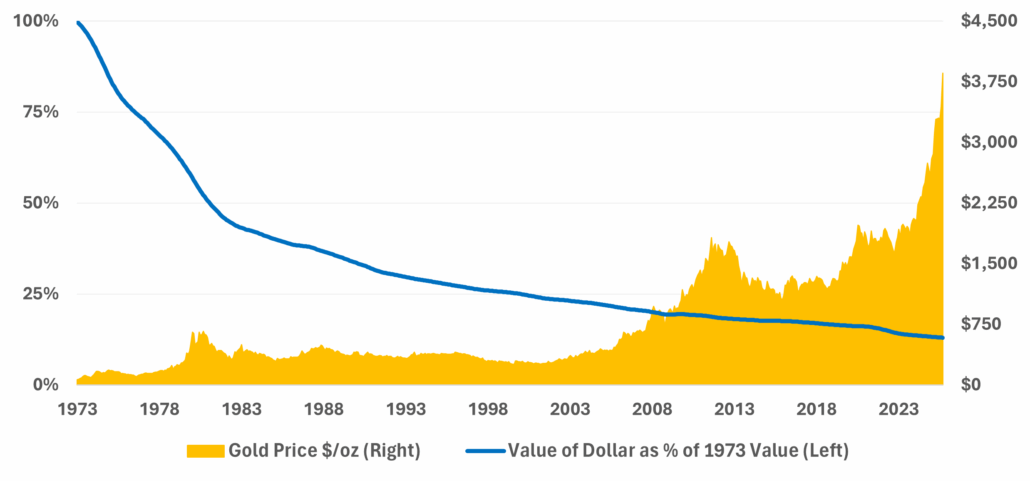
For half a century, gold has done what the dollar promised to do: hold its value.
The Asset That Kept Its Promise: After Inflation, Gold Still Wins14
Gold has delivered positive real returns across decades of shifting policy regimes.
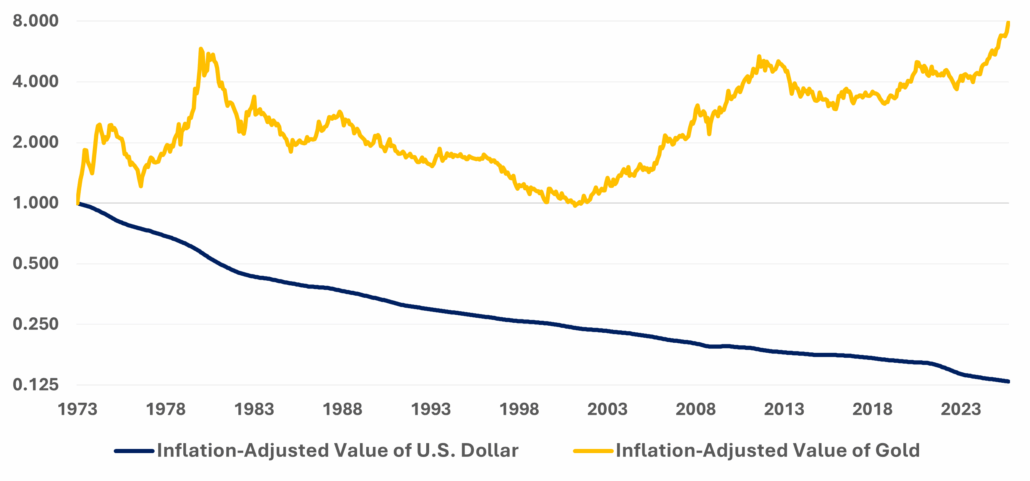
Since 1973, gold has generally outpaced inflation. Its purchasing power has endured while fiat currencies have come and gone. Now, even the world’s largest central banks are accumulating gold again.
13Bloomberg LP. Board of Governors of the Federal Reserve. OECD. September 2025.
14Bloomberg LP. OECD. September 2025.
Gold Isn’t Fear, It’s Discipline
The U.S. government can’t cut spending without risking a collapse in confidence. So, it will likely take the easier road and let inflation do the work, whether it be official policy or not. The result will be that every dollar will buy a little less each year; not a typical immediate crisis, but rather a long-term process. Those who wait may be too late.
The role of the advisor isn’t to calm the storm; it’s to build an ark and make sure it floats as the flood of dollar devaluation continues to rise. It is difficult for clients to diversify away from Washington’s fiscal math, but they can own something that isn’t bound by it. An allocation to gold can be a fundamental part of the ark.
By positioning clients in gold, financial advisors offer the potential to defend purchasing power. Making modest allocations to gold isn’t about timing markets; rather, it’s about anchoring wealth to something real. Real wealth is measured by what endures when paper promises don’t, not necessarily just what your account statement tells you.
In a world where yield alone can’t buy stability, gold restores value-driven discipline to the modern income portfolio, offering the potential to protect purchasing power when it’s under the greatest attack. By combining gold with income producing assets, investors may be able to hedge their income against inflation. This design seeks to avoid the decline in purchasing power that continues to burden many.
Those who treat gold as a mere “trade” risk will miss its purpose; those who treat it as value-driven discipline are typically better able to preserve real wealth over time.
The role of the advisor isn’t to calm the storm; it’s to build the ark
Advisor Playbook Summary
- Inflation isn’t merely an economic cycle, it is increasingly a fiscal policy.
- Bonds no longer adequately defend income on their own.
- Gold isn’t just for speculation, it’s equally about wealth preservation and should be considered a value-driven discipline in physical form.
- A small allocation has the potential to make a lasting difference.
Is This the End of the Dollar as the World’s Reserve Currency?
Key Takeaways
According to Milton Friedman, there are four ways to spend money: spending your money on yourself, spending your money on someone else, spending someone else’s money on yourself, and spending someone else’s money on someone else. Why is this important? Because this construct helps explain how we went from the U.S. dollar securely holding the position of the world’s reserve currency to where it seems to be a matter of when, and not if, it will lose that status.
Prior to the 1970’s, the U.S. government historically operated with some degree of fiscal responsibility, partially because of the requirements under the Bretton Woods System (“BWS”) where the dollar was fixed to the price of gold. BWS dissolved between 1968 and 1973, and, by 1973, all major currencies began to float against each other1. In this free-floating system, the USD retained its status as the world’s reserve currency, leveraging the historical standard it had under BWS in the post-war era.
In the absence of fiscal constraints, like pegging the dollar to gold, it became clear that the U.S. government was spending someone else’s money — with little care and by printing as much as it could without risking the reserve currency status. As the years went on, the debt-financed deficits became more extreme and increasingly politically motivated. No end is in sight. De-dollarization has already started and is likely to continue.
In this environment, it comes as no surprise that gold continues to make headlines, whether from large central bank purchases, to record prices, to individuals buying up all the gold bars that Costco can stock. Gold is uniquely positioned to retain its value even in the face of extreme fiscal irresponsibility. In this white paper, we make the argument for why investors should hold gold and why gold is well positioned to replace the U.S. dollar as the world’s hard reserve currency.
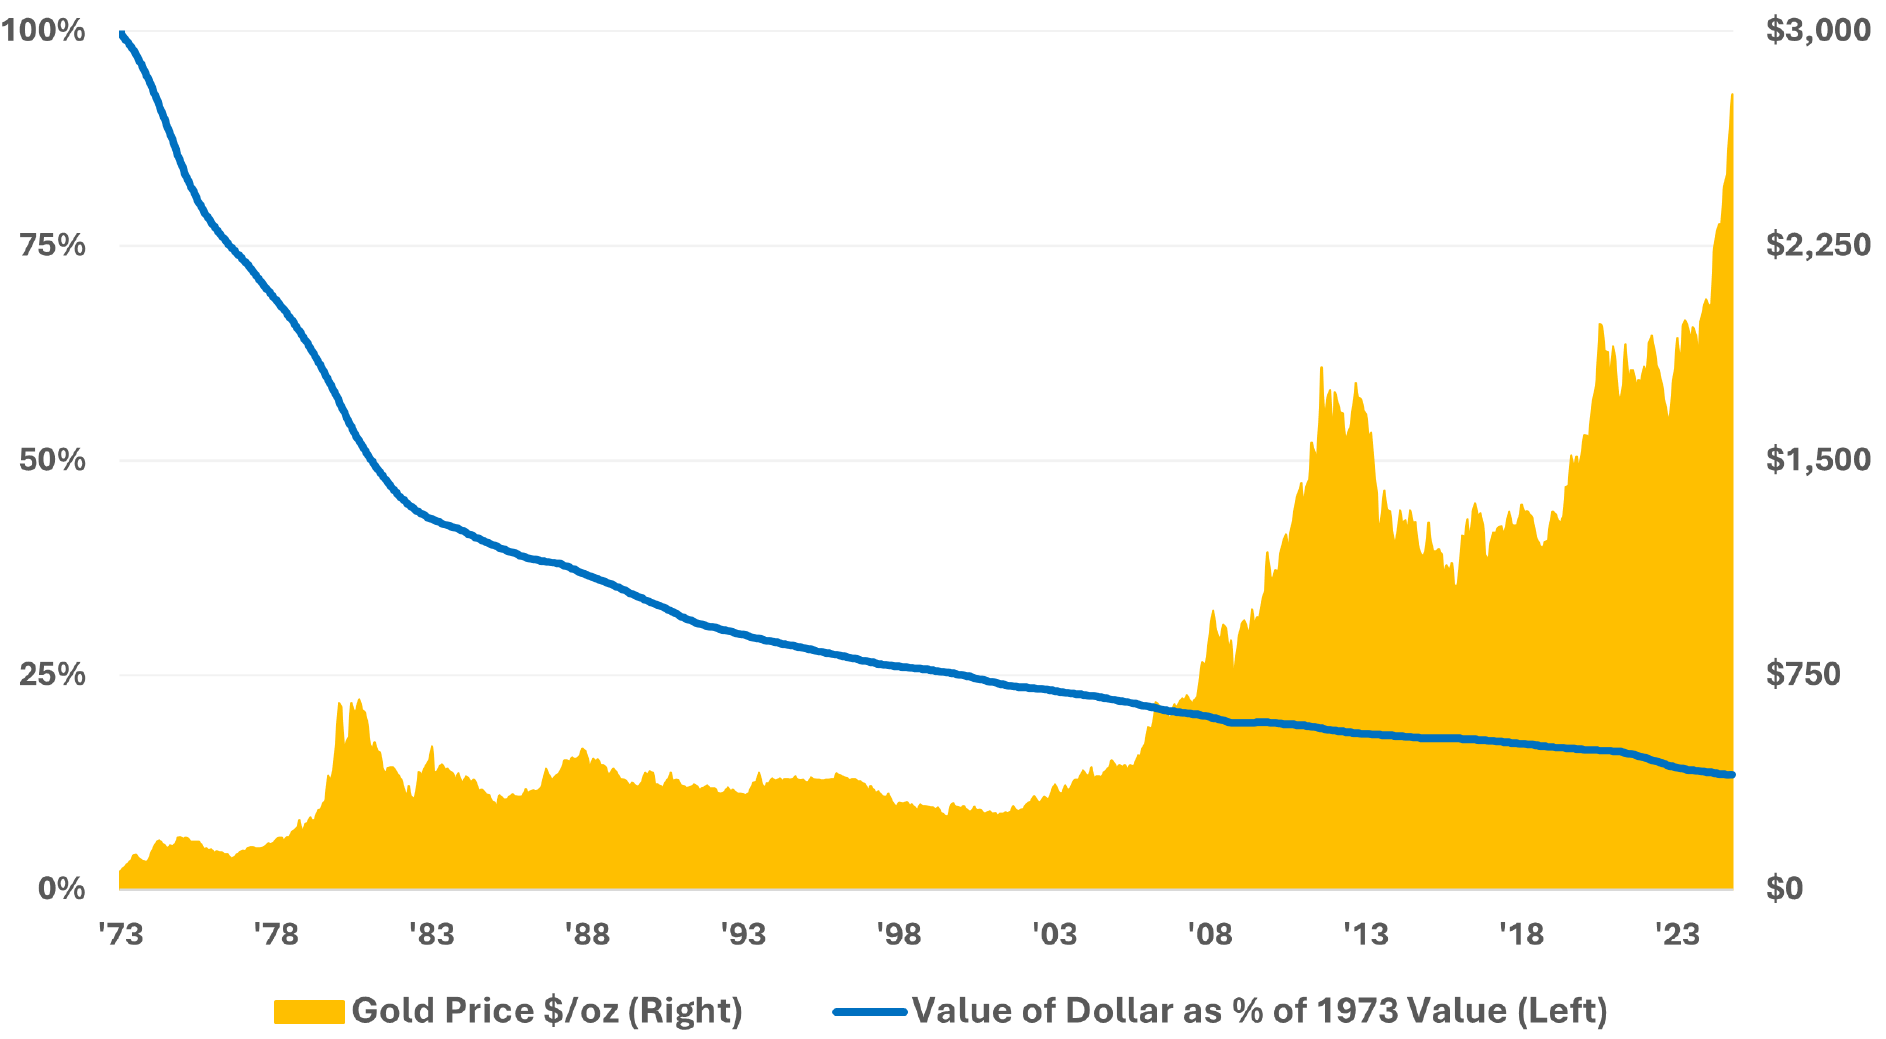
Since the end of the Bretton Woods System, the dollar has tanked while gold surged2
1International Monetary Fund. The end of the Bretton Woods System (1972-81).
2Bloomberg LP. Board of Governors of the Federal Reserve. OECD. September 2024.
U.S. GOVERNMENT BUDGET DEFICITS AND DEBT ISSUANCE
To understand the driving factors behind the decline in the value of the dollar and the surge in the price of gold, one of the best places to start is by reviewing the fiscal policy of the U.S. government
The U.S. government spent $1.83 trillion more than it brought in during 20243
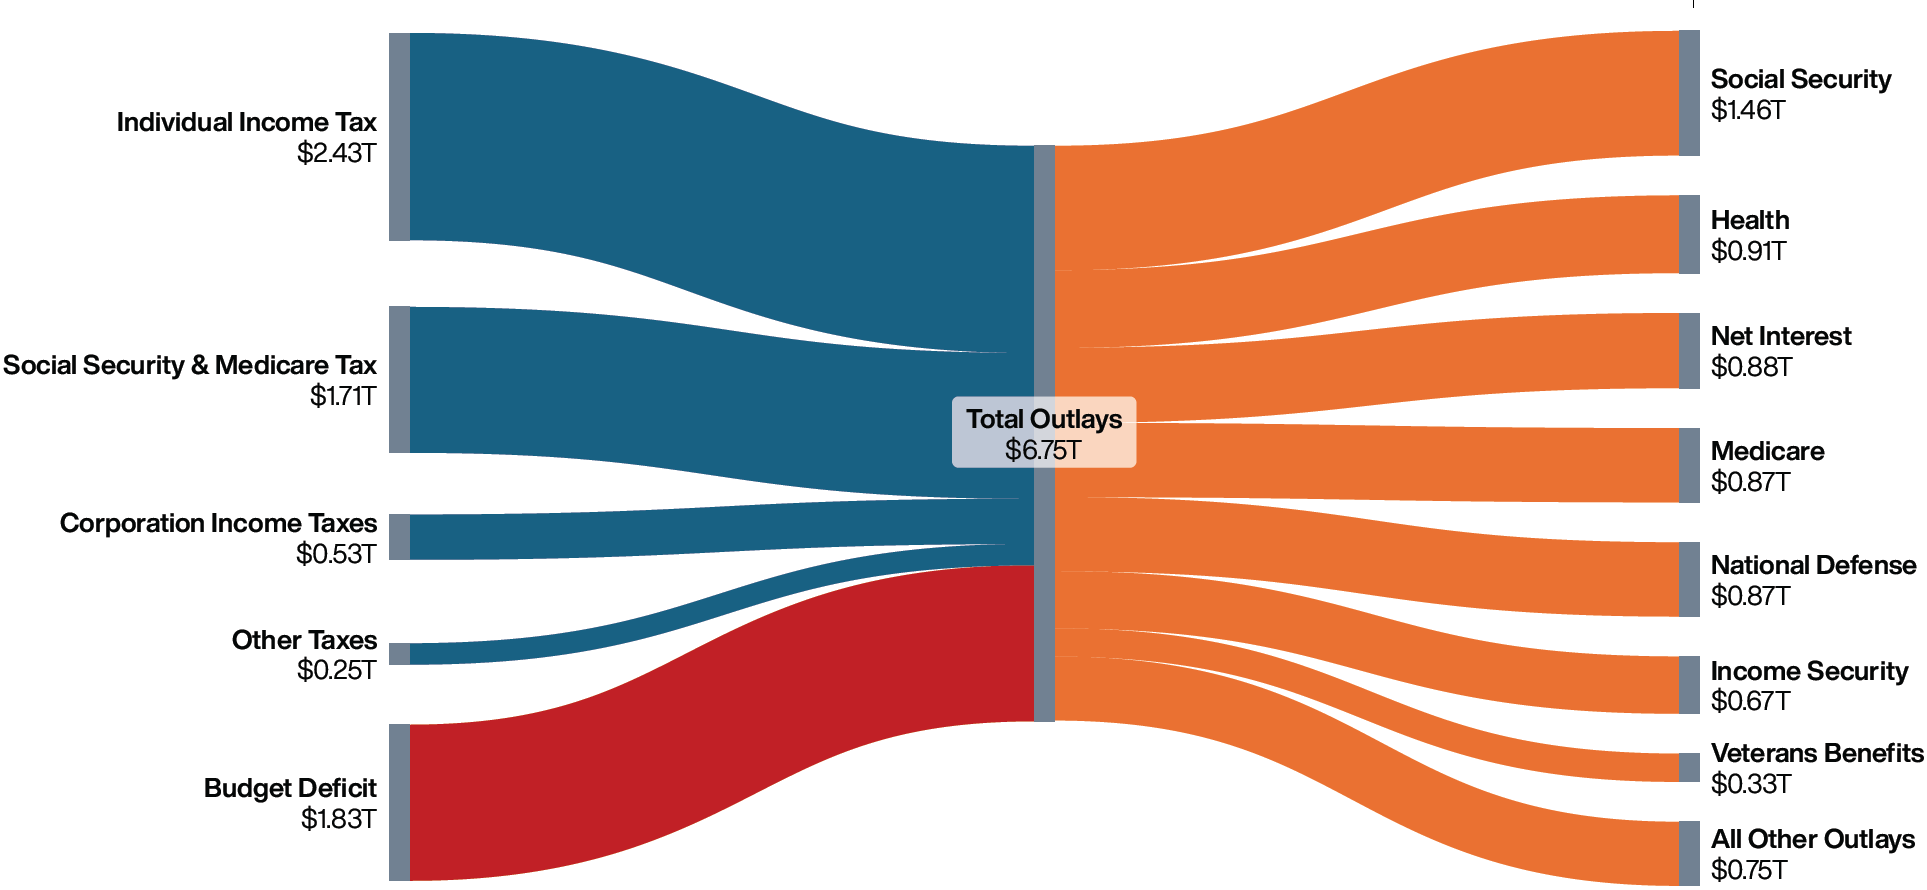
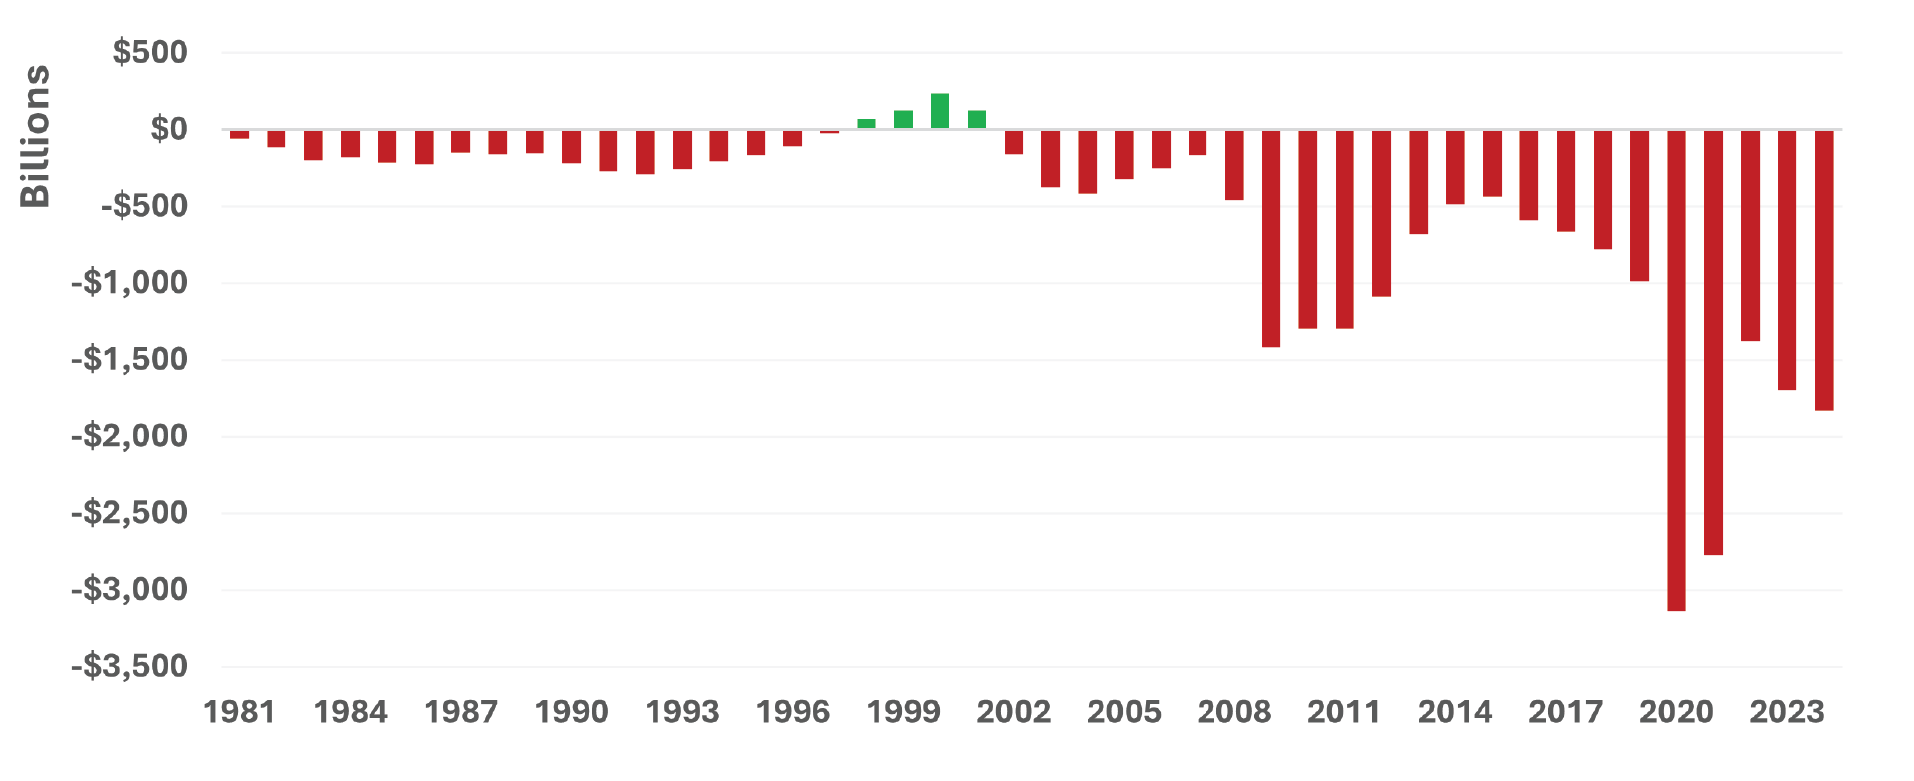
Following the end of BWS, the U.S. federal government was able to run a deficit with limited consequences. This accelerated over time to astronomical levels of spending following the great financial crisis in 2008.
There is usually a budget deficit and in 2024 it grew to the highest ex-pandemic level4
3U.S. Department of Treasury. September 2024.
4U.S. federal deficit or surplus. U.S. Department of Treasury. Federal Reserve Economic Data. Based on monthly data through September 2024.
So how does the government continue to operate if it is consistently spending more than it brings in? It issues debt by selling Treasurys and other securities.
Years of budget deficits have ballooned U.S. national debt to almost $36 trillion5
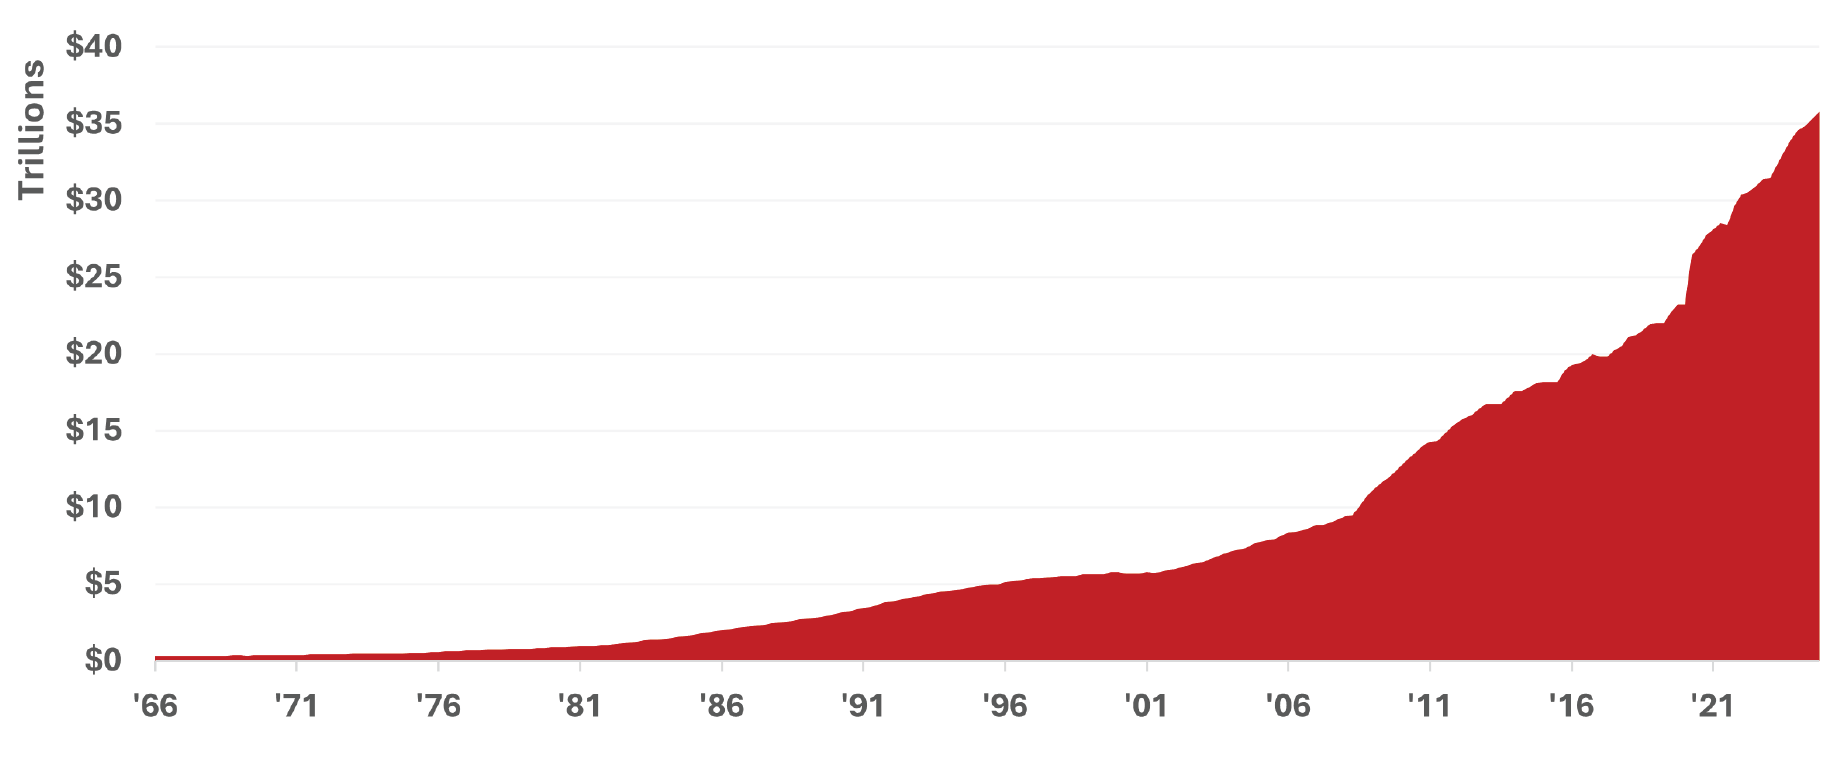
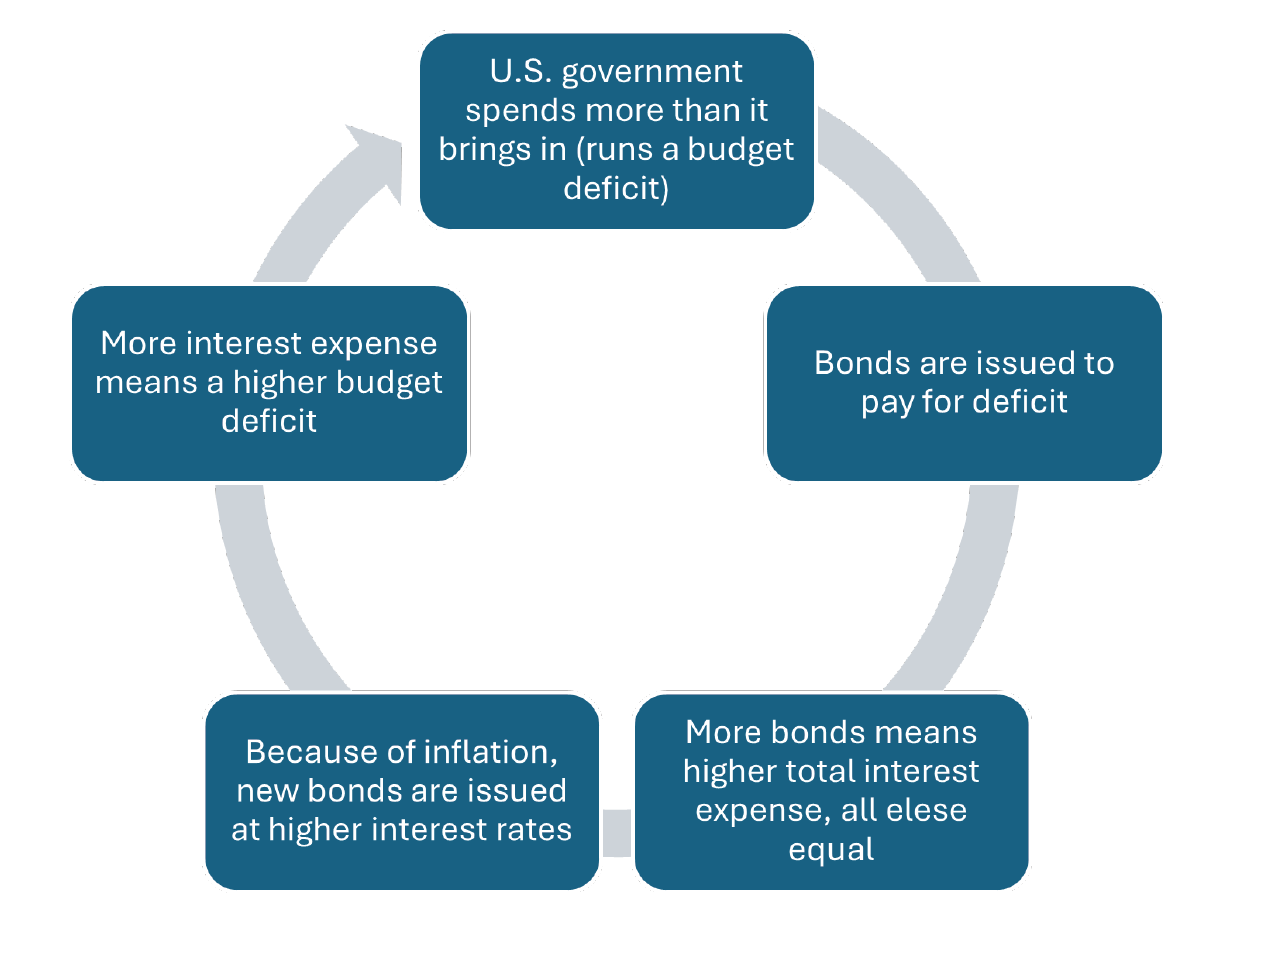
All else equal, growing amounts of debt will lead to higher interest expense payments. This is a problem because debt is becoming an increasingly large government outlay that, without changes to fiscal policy, will require more debt issuance simply to pay the interest expense.
Growing national debt is expected to increase interest expense outlays as % of GDP6
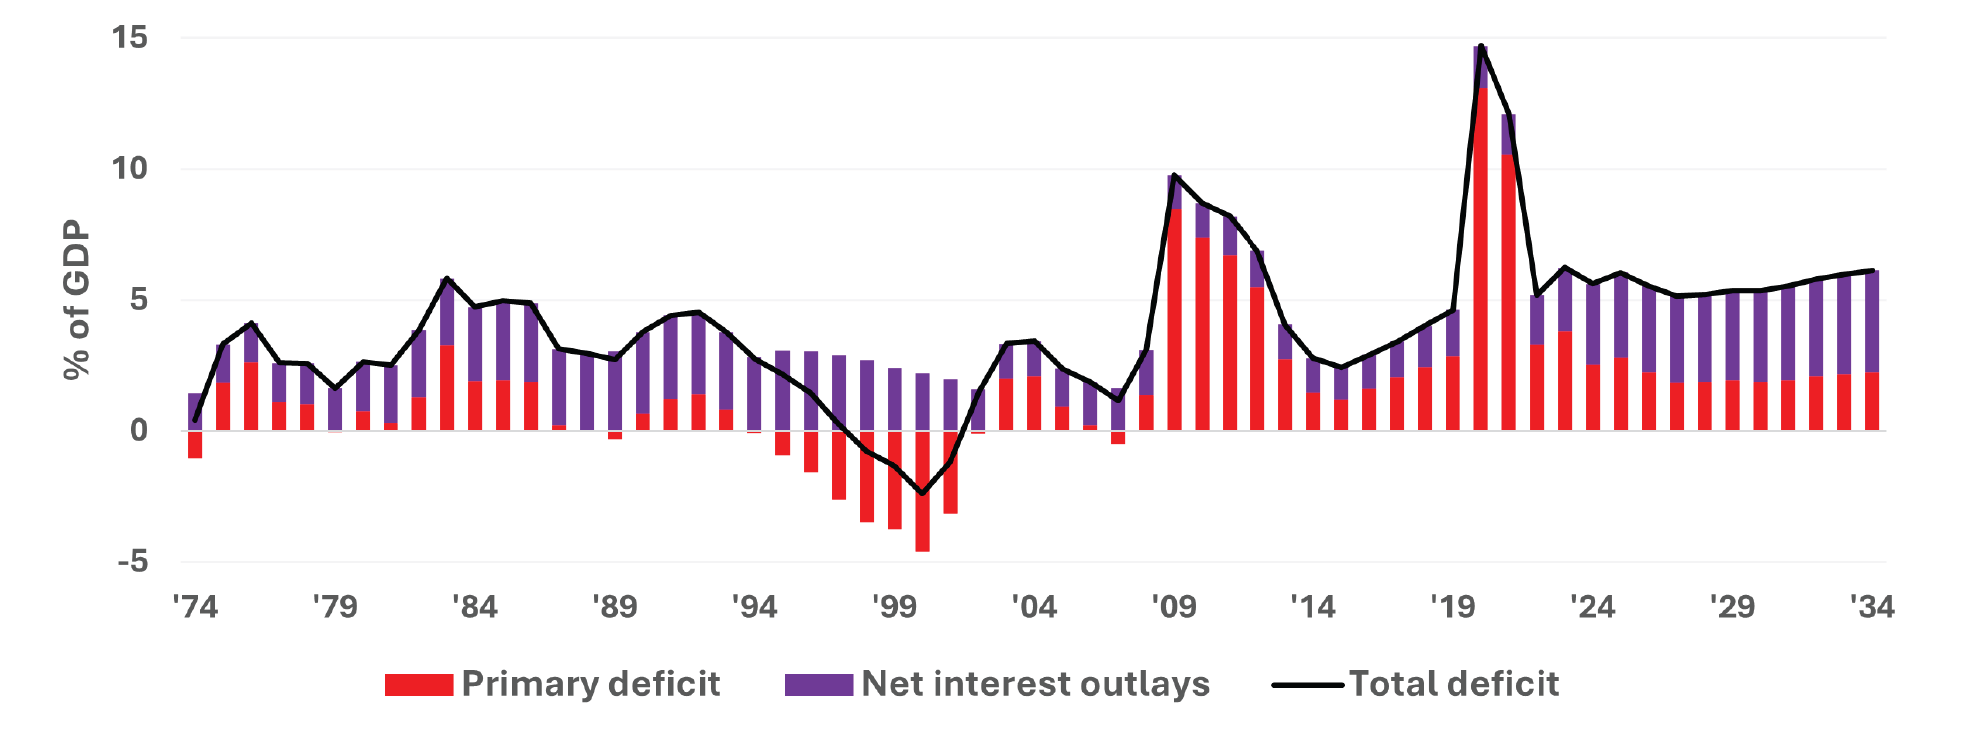
For the first time ever in 2024, interest expense on U.S. federal government debt held by the public surpassed $1 trillion. It is the second largest expenditure and set to become the largest.7
5Department of Treasury. Debt held by the public. Based on quarterly data through April 2024.
6Congressional Budget Office. The Budget and Economic Outlook: 2024 to 2034. Published February 2024.
7U.S. Bureau of Economic Analysis. September 2024.
FEDERAL RESERVE: MONEY PRINTING, INTEREST RATES, AND INFLATION
The next important player in this story is the Federal Reserve (the “Fed”). In its own words, “the Federal Reserve System has been given a dual mandate, pursuing the economic goals of maximum employment and price stability. It does this by using a variety of policy tools to manage financial conditions that encourage progress toward its dual mandate objectives—in other words, conducting monetary policy.”8
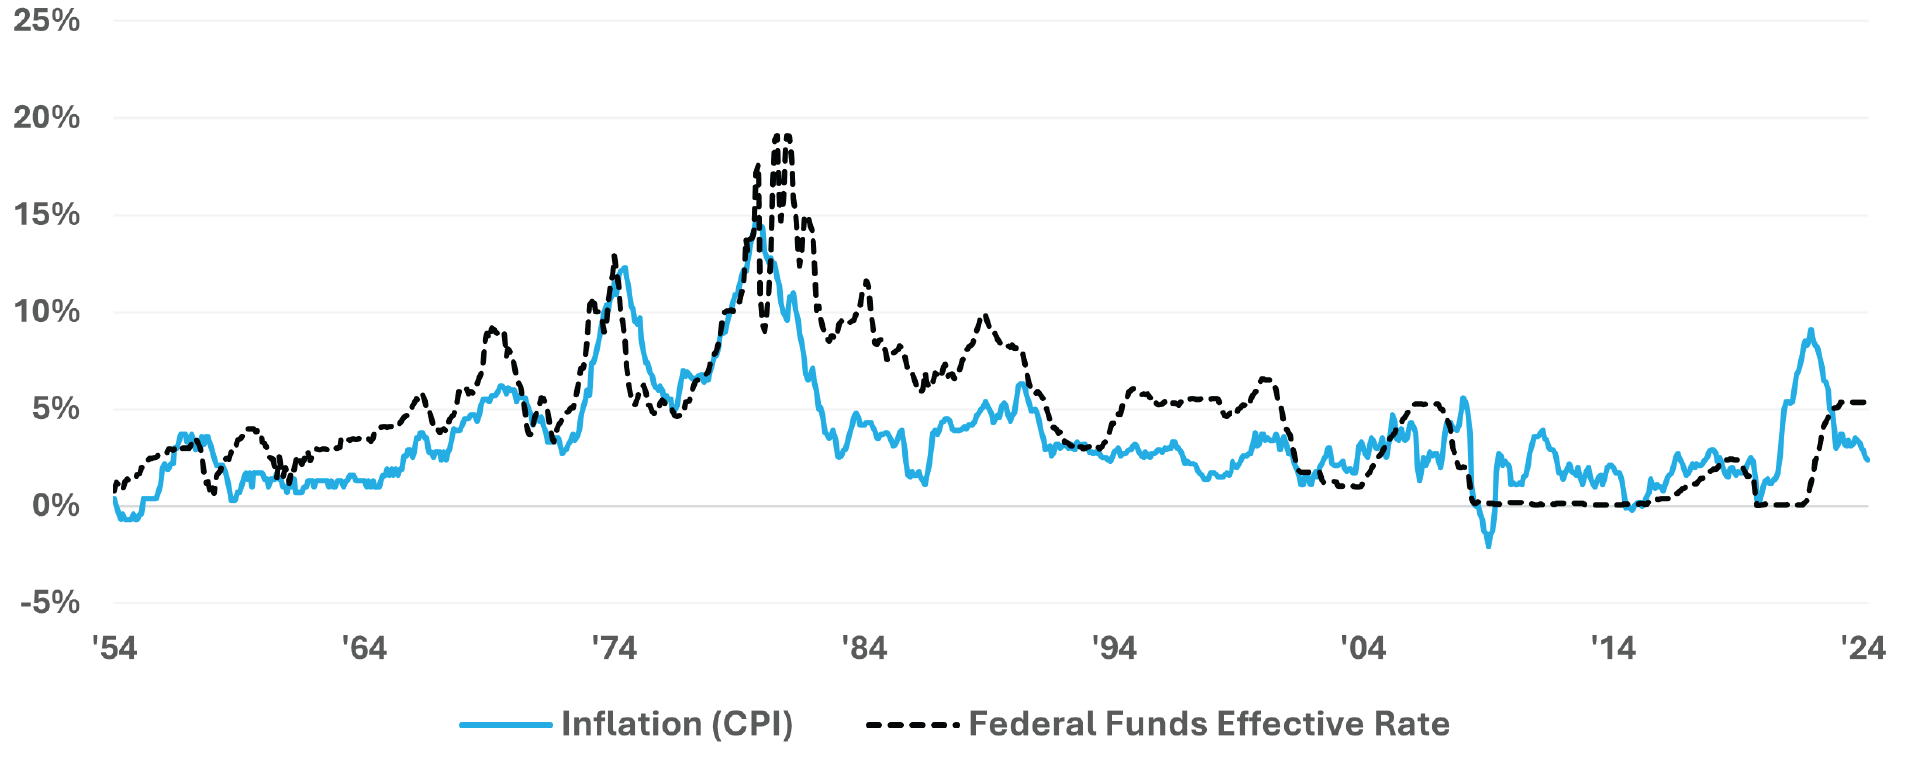
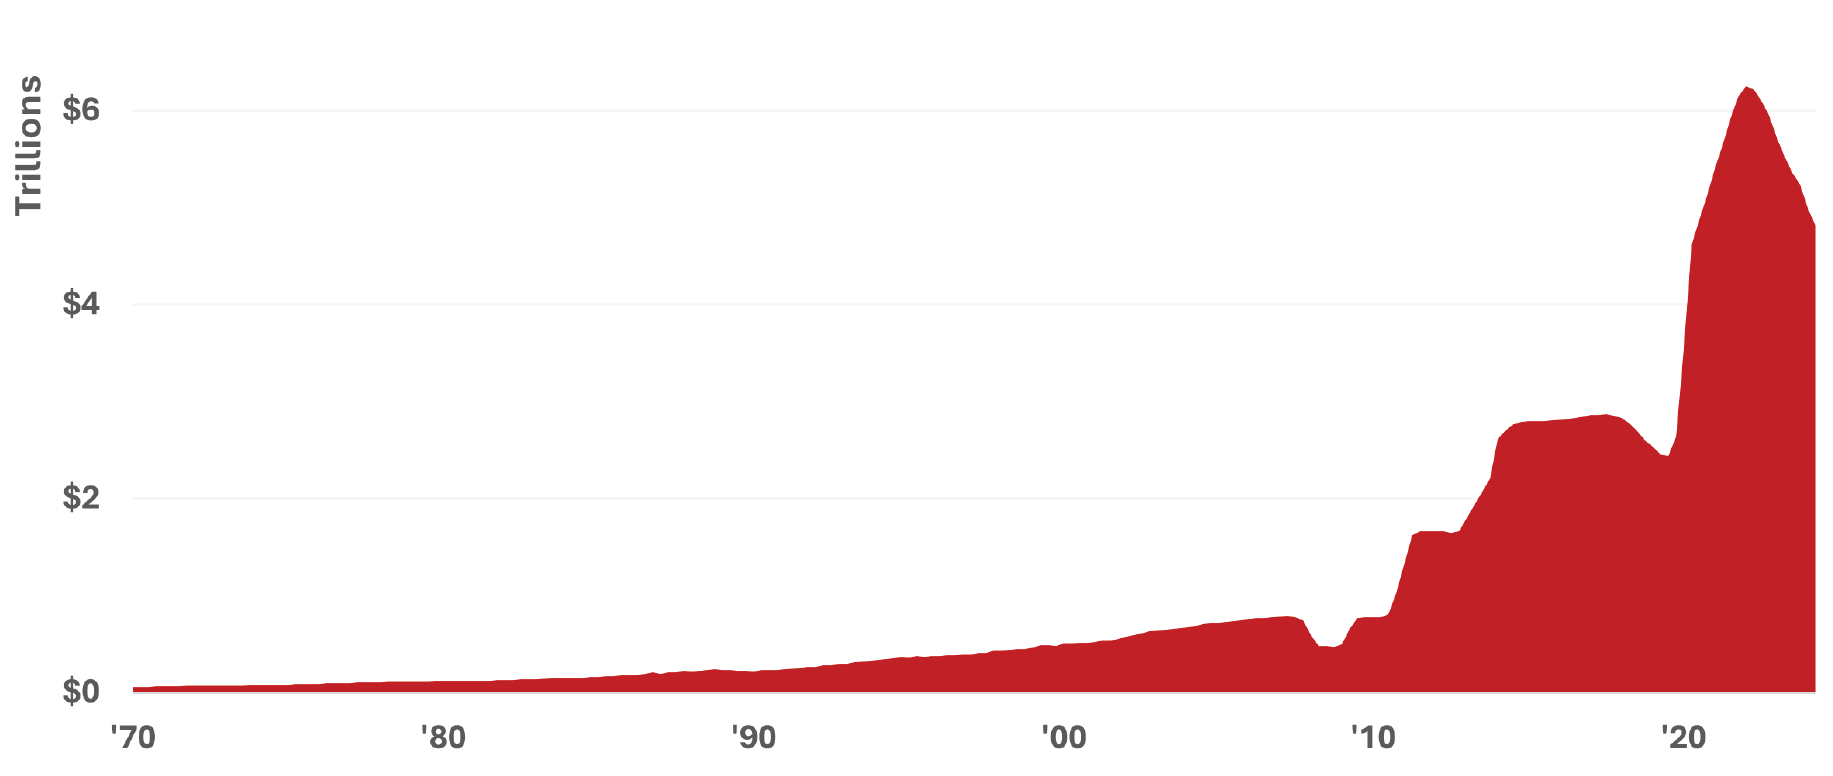
Following the great financial crisis in 2008, the Fed, through a process called Open Market Operations, brought interest rates to zero and implemented emergency spending programs. Initially, the goal was to stabilize the economy. However, it maintained rates near zero and continued spending programs despite a strong economy. The result: a significant increase in the money supply, inflation, and dollar debasement.
The Fed held interest rates near zero following 2008 until inflation hit 40-year highs9
The Fed’s holdings of federal debt peaked at over $6 trillion in 202210
8St. Louis Federal Reserve Bank. The Fed and the Dual Mandate.
9Bloomberg LP. OECD. Federal Reserve Bank of New York. October 2024. The effective federal funds rate (EFFR) is calculated as a volume-weighted median of overnight federal funds transactions reported in the FR 2420 Report of Selected Money Market Rates.
10U.S. Department of Treasury. September 2024.
The Fed’s actions ballooned the money supply and eroded the value of the dollar11
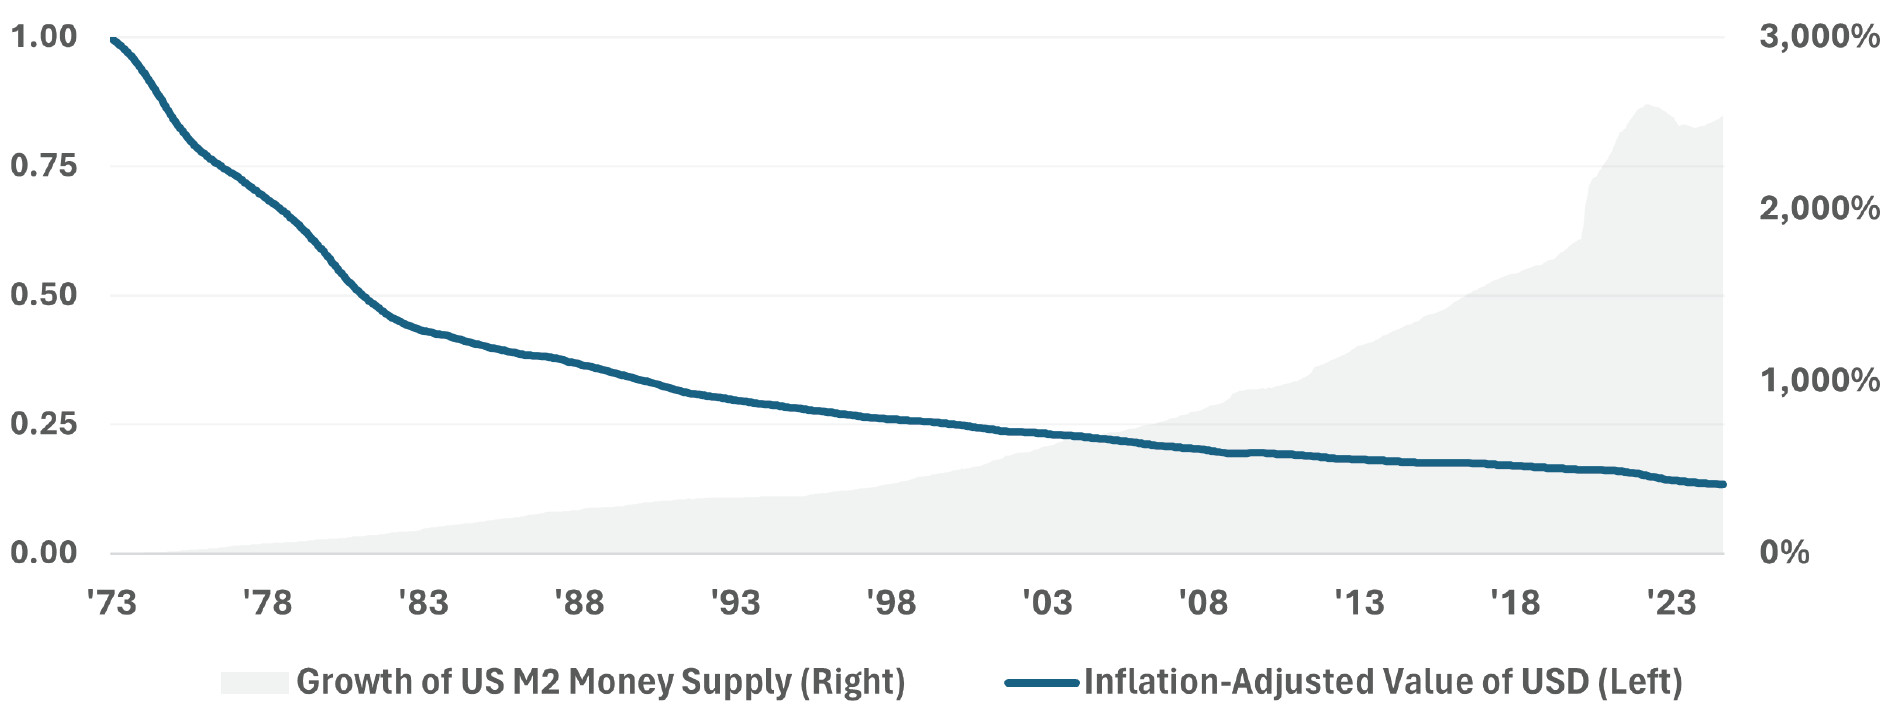
The M2 money supply is a measure of the total dollars in cash deposits and other deposits readily convertible to cash, such as money market funds. The Fed’s actions since 2008 significantly inflated the M2 money supply, growing it 159%. From 2020 to 2024, the M2 money supply grew by 38%. When all this money enters the financial system, the value of the dollar erodes in a process called dollar debasement. This is why a dollar today is worth only $0.13 of a dollar in 1973.
Another consequence is inflation. Following a 40-year high in inflation in 2022, the Federal Reserve was required to enter one of the steepest interest rate hiking cycles in history. Interest rates went from zero to over 5%. A consequence was that the new debt issued by the federal government was done at much higher interest rates.
The U.S. federal deficit has created a self-perpetuating debt cycle
11Bloomberg LP. Board of Governors of the Federal Reserve. OECD. September 2024.
DECLINING DOMINANCE OF THE U.S. DOLLAR
Thus far, the U.S. has survived the self-perpetuating debt cycle because of the dollar’s status as the world’s reserve currency. This status carried over from the Bretton Woods era post-1973 and was maintained because of the United States’ standing as an economic and military leader with political stability. Essentially, the U.S. dollar has been perceived as a safe and stable currency for which the
world can conduct trade and financial transactions. Yet, the U.S. dollar’s status as the world’s reserve currency continues to decline in a process known as de-dollarization. The most used benchmark of the U.S. dollar’s status, known as the percentage of total foreign exchange (“FX”) reserves, reveals that the dollar dropped from 71% of reserves in 1999 to just 58% in 2024.12
Despite its dominance, the U.S. dollar as a % of FX reserves continues to drop13
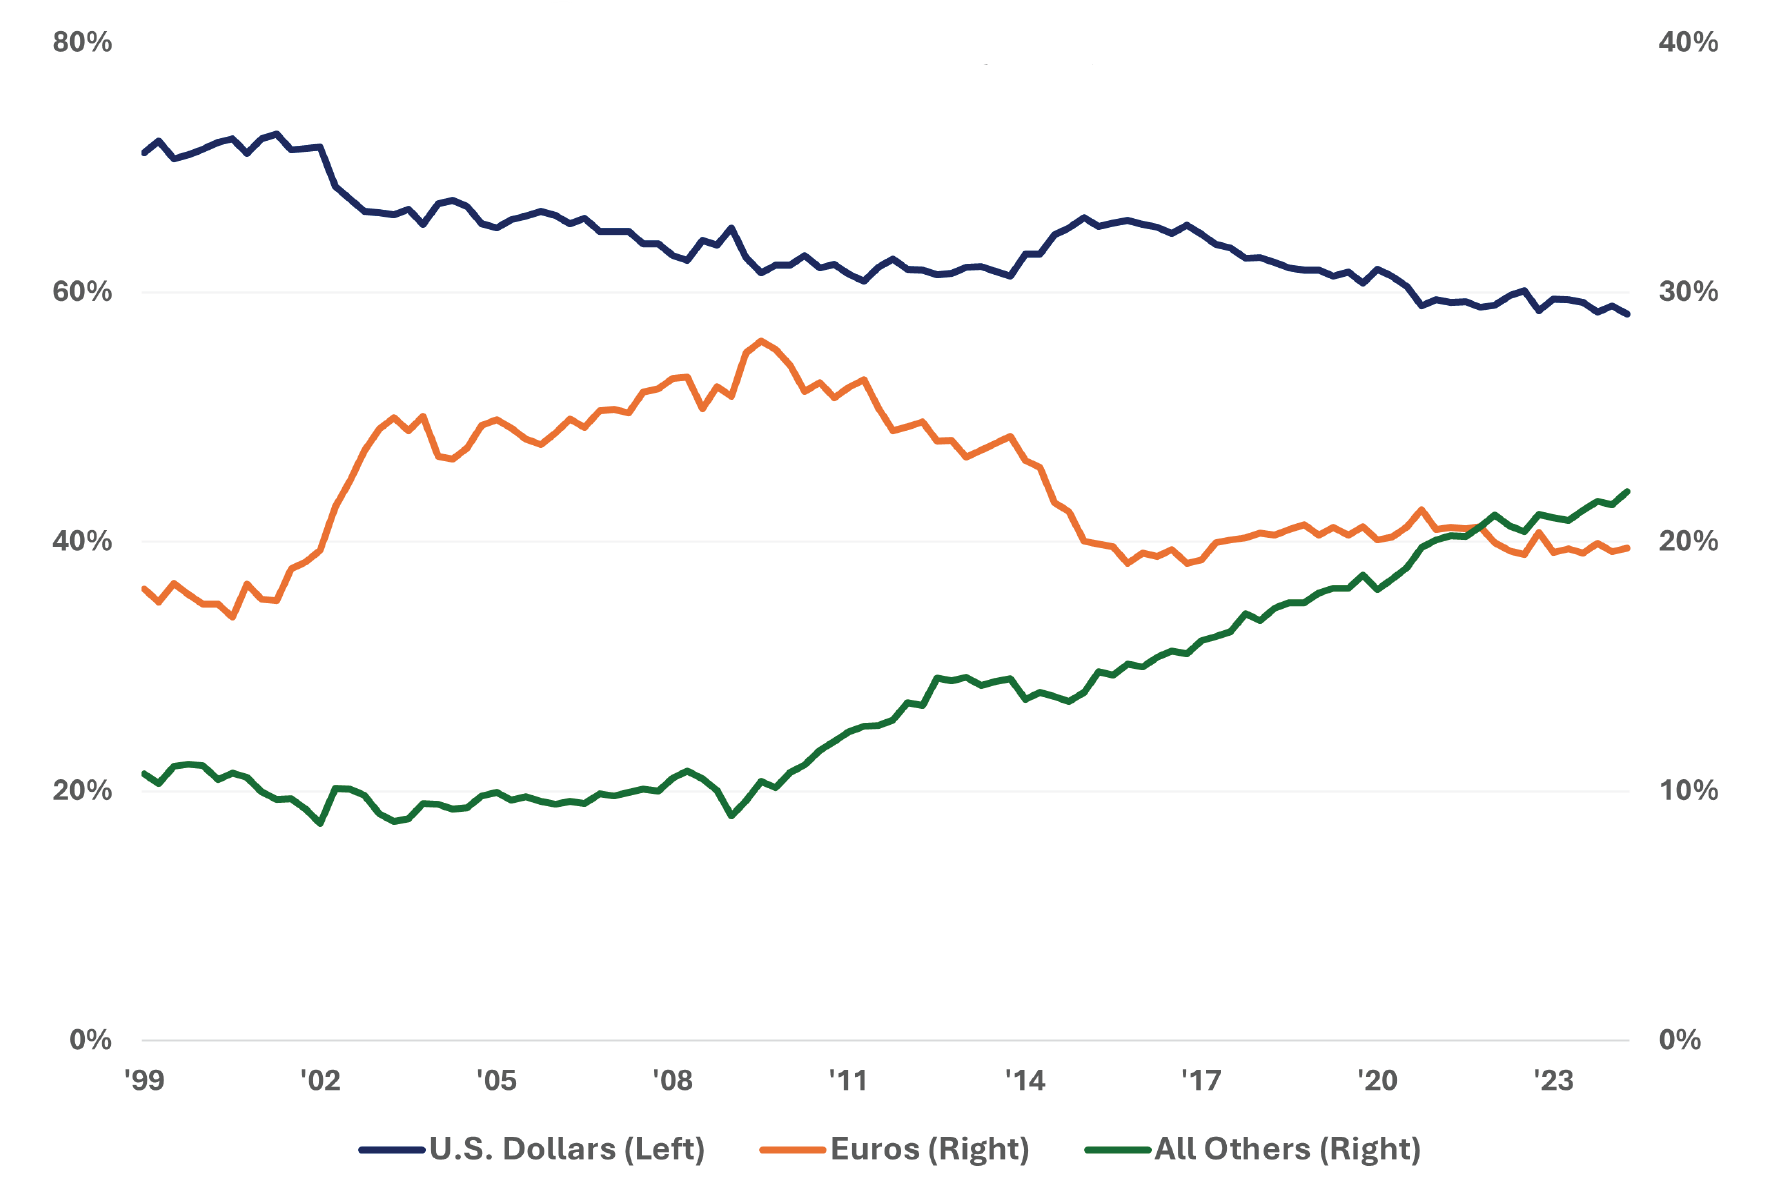
There are two themes underlying the decline in the U.S. dollar. The first is the decline in the perception of the stability of the U.S. dollar and the political system that backs it. The second is a natural movement to alternative systems which better facilitate trade and transactions. In this paper, we focus on the first.
From a geopolitical perspective, the U.S. government has shown its willingness to weaponize the U.S. dollar. Following Russia’s invasion of Ukraine in 2022, the U.S. Department of Treasury’s Office of
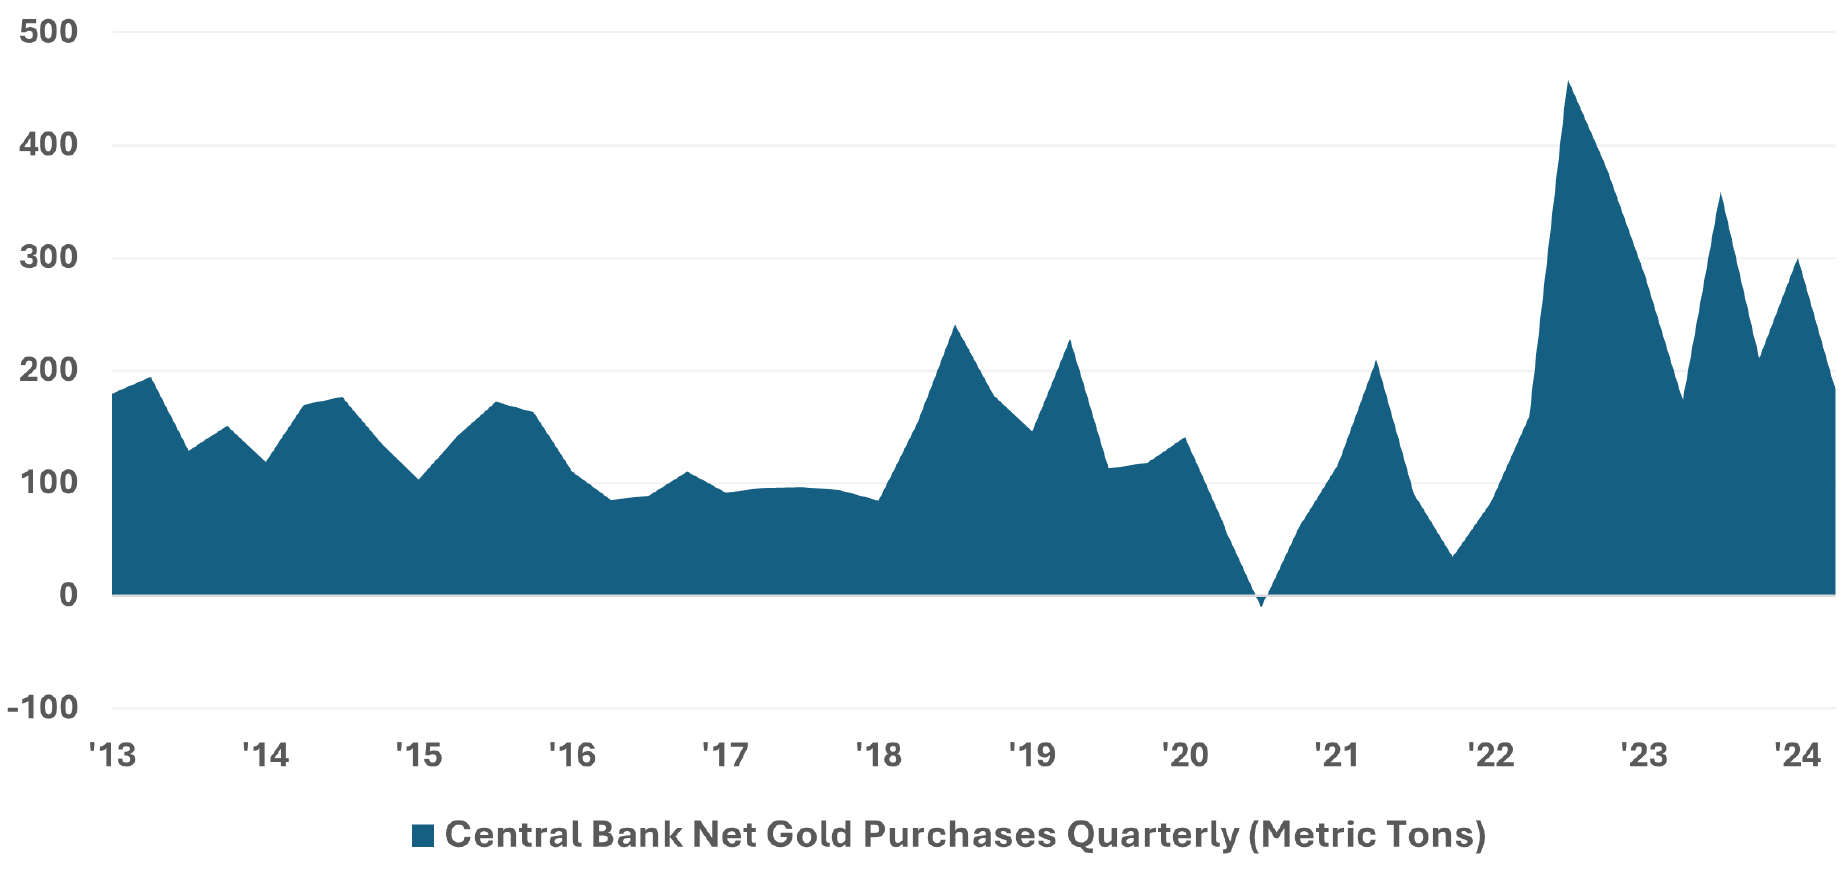
Foreign Assets Control disconnected several Russian banks from the international financial system backed by SWIFT. These banks conducted approximately 80% of their $46 billion of foreign exchange transactions in U.S. dollars.14 Other adversaries of the United States have been threatened with the same. Despite a country’s relationship status with the United States, this type of action raises concerns about the viability of the U.S. dollar and has led many central banks to seek out alternatives, including gold.
12IMF COFER.
13Bloomberg LP. IMF COFER. September 2024.
14U.S. Department of Treasury Press Release. U.S. Treasury Announces Unprecedented & Expansive Sanctions Against Russia, Imposing Swift and Severe Economic Costs.
Central banks increased quarterly purchases of gold following dollar weaponization15
In 15 years, foreign investors went from holding almost 50% of the total U.S. debt held by the public to just 30%16
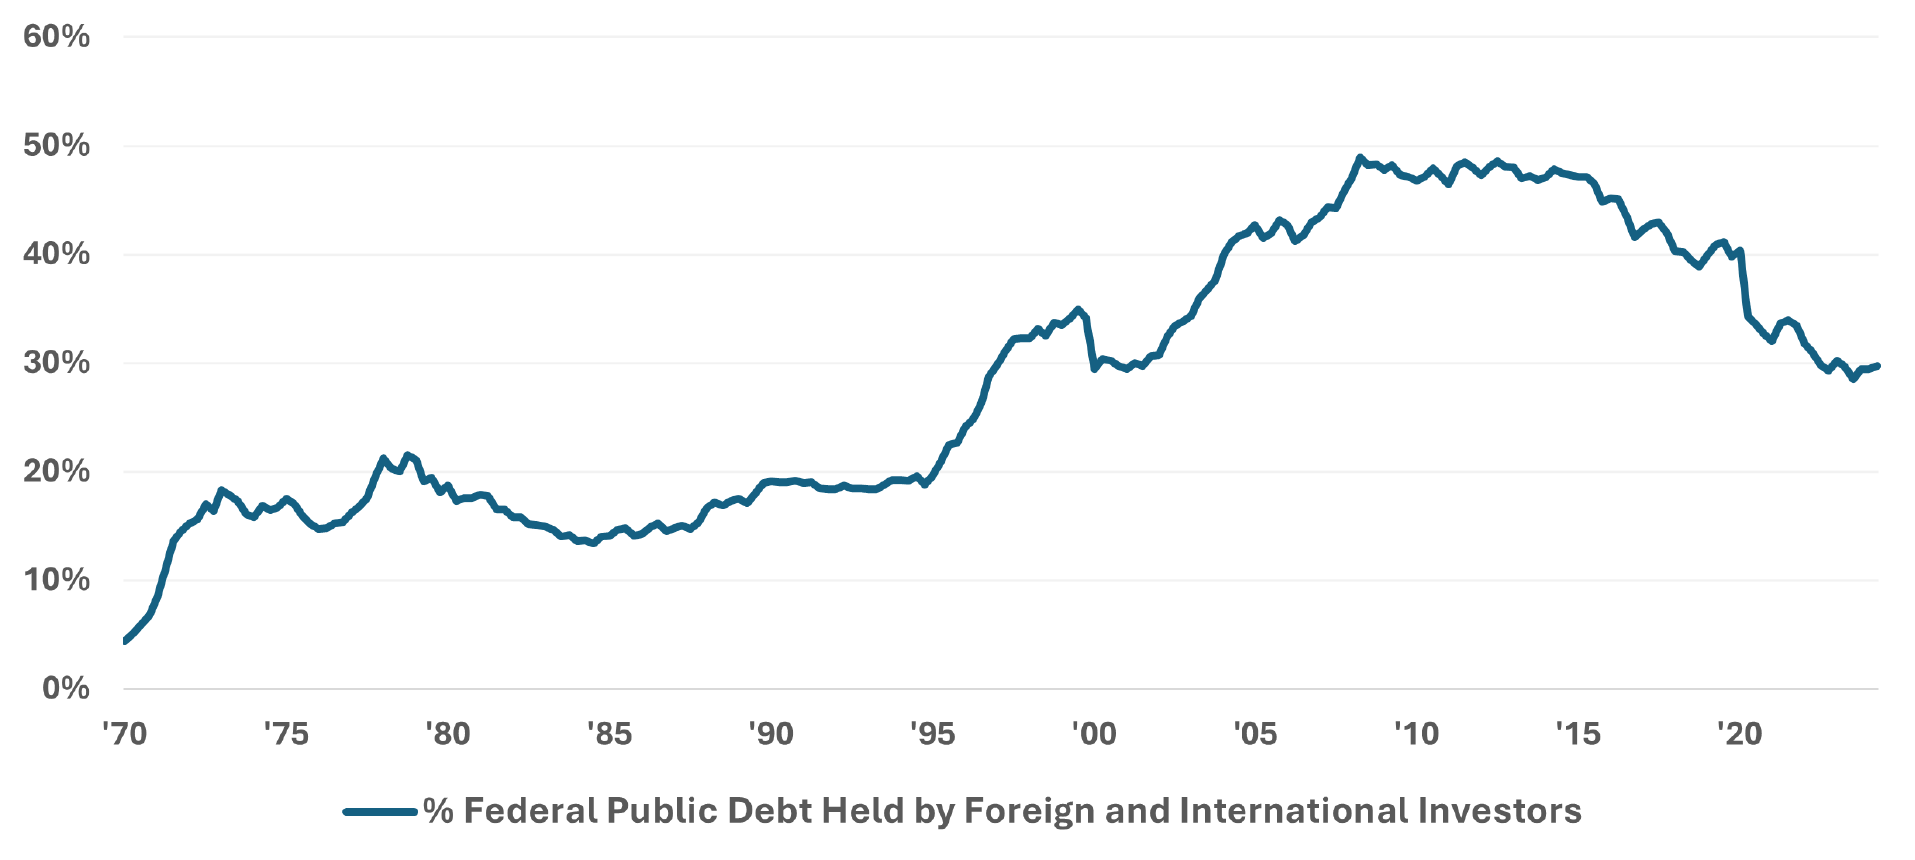
The growing debt problem in the United States raises a lot of concerns. It is uncertain how these levels of deficits and debt can be maintained, especially if inflation requires interest rates to go up. The world’s reserve currency status made U.S. federal debt and attractive option for foreign purchasers. Yet there is a growing trend where foreign
and international investors are becoming a smaller fraction of total public holders of U.S. federal debt. It should come as no surprise that dollar devaluation via money printing is the result, at least in the short-term where there are enough willing buyers of U.S. federal debt.
15Bloomberg LP. Quarterly demand (net purchase) data. June 2024.
16U.S. Department of Treasury. April 2024.
LOOK TO GOLD AS A SOLUTION TO A DECLINE IN THE U.S. DOLLAR
Gold has served as mankind’s most enduring form of money for millennia and has always played an important role in the international monetary system. It was the basis for the value of the U.S. dollar and foreign currencies prior to the end of the Bretton Woods System in 1973.
Gold’s unique attributes have well positioned it to play this role. Beyond its physical properties as a precious metal, scarcity is one of the most important attributes in terms of its enduring value.
Only 244,000 metric tons of gold have been discovered today, including 57,000 metric tons underground; a simple container 23 meters on each side could hold all the gold discovered thus far.17
Gold cannot be turned into a money printing machine. Unlike the U.S. dollar, gold is not backed by debt and has maintained its purchasing power during periods of inflation. Gold’s value is derived independent of the holder or counterparty, and it is not able to be manipulated for political purposes.
As the value of the dollar erodes from poor fiscal policy and de-dollarization, Gold has already demonstrated its value18
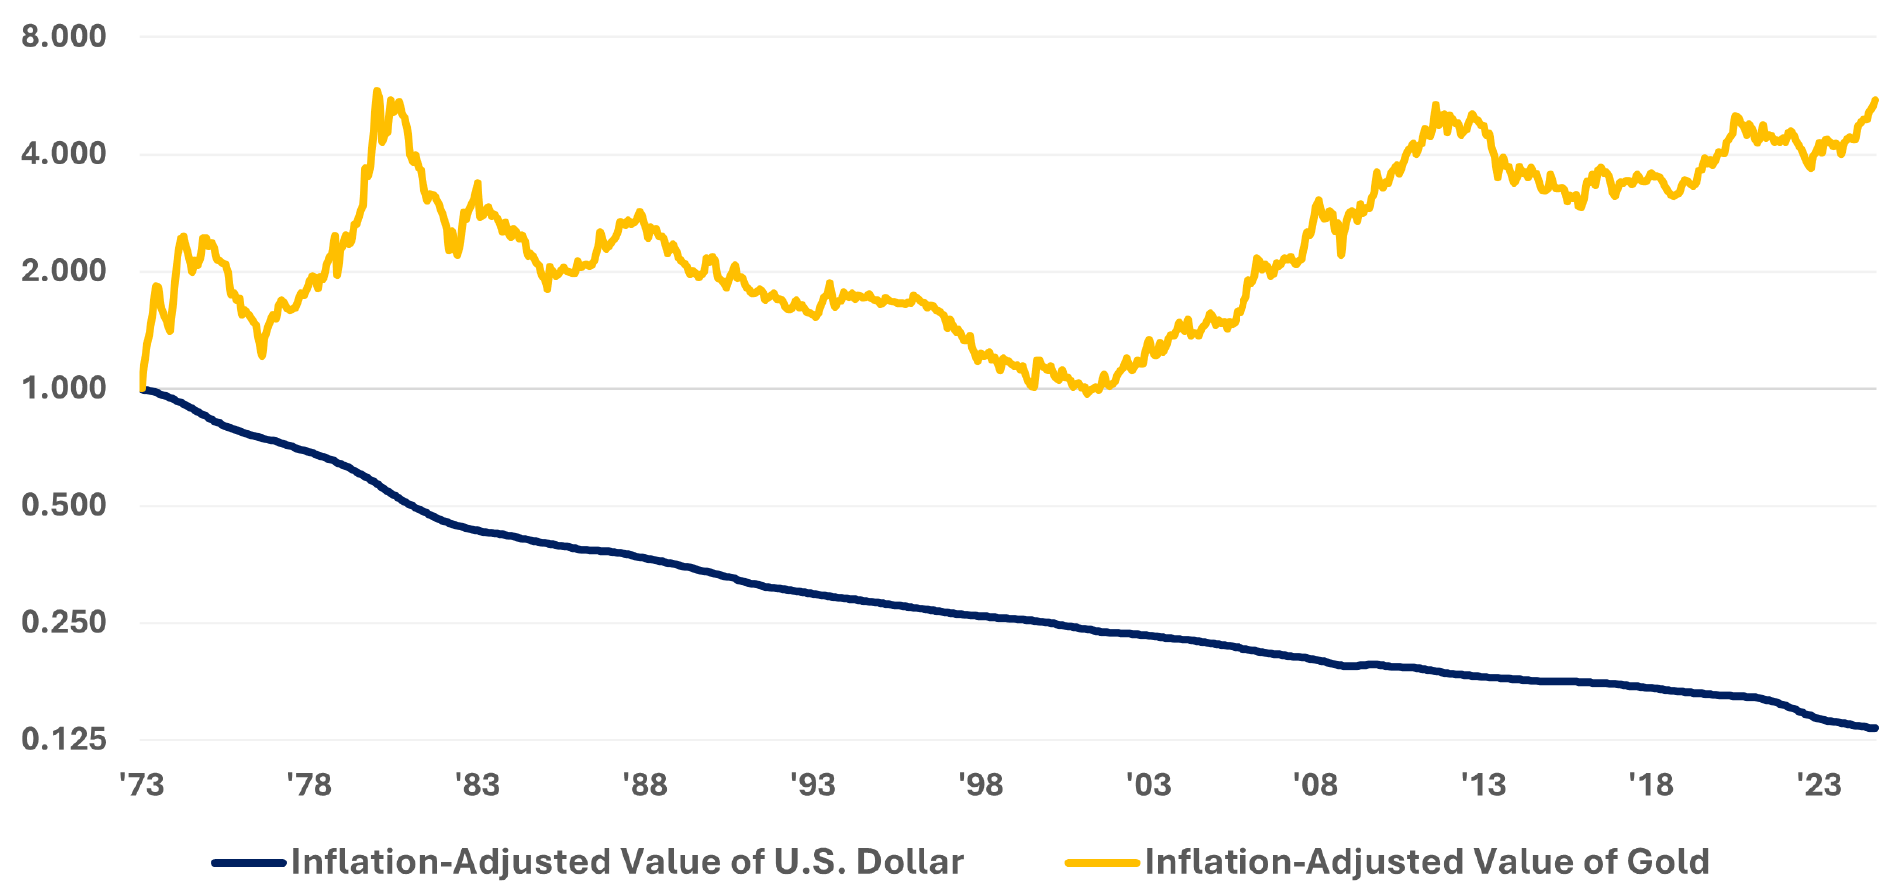
Even after adjusting for the impact of inflation, $1 worth of gold in 1973 is now worth over $5 while the value of $1 in 1973 is only worth $0.13 in 2024. In fact, except for a very brief period in 2001, the inflation-adjusted value of gold has always been higher than it was in 1973, demonstrating its resilience as a hedge against inflation.
Gold is at record highs and strong trends are already underway that should serve as tailwinds for
the price of gold. Without any meaningful change in U.S. fiscal policy, which seems unlikely as we sit here in 2024, the price of gold could continue to skyrocket. Investors have several choices when it comes to accessing gold. Investors can leverage their gold exposure to also generate a yield by combining a gold overlay with other income-producing strategies. This approach allows investors to access gold while putting their money to work in strategies that can regularly pay them now.
17U.S. Geological Survey. How much gold has been found in the world?
18Bloomberg LP. OECD. September 2024.