
For most of your working life, investing is wonderfully straightforward: earn, save, invest, repeat. Your portfolio has one big job: growth. Then retirement arrives, and the job description changes overnight. Now those same assets must help cover groceries, travel, property taxes, healthcare, hobbies and all the rest, potentially for decades, without surrendering tomorrow’s purchasing power to today’s bills.
Here is the challenge: building wealth and turning wealth into dependable income are not the same investment problem. In retirement, the timing of withdrawals can materially affect results. If assets must be sold during a market decline, an investor needs to sell more shares to raise the same amount of cash, leaving fewer shares available to participate in a subsequent recovery.

The retirement income dilemma
Say you retire with $750,000. The math looks friendly enough: 3% is $22,500 a year; 4% is $30,000; 5% is $37,500; and 7% is $52,500. Easy arithmetic. The hard part is making that money endure through bull markets, bear markets, inflation and a retirement whose expiration date, thankfully, no one knows. The second greatest unknown is the order and timing of those events: a market drop early in retirement, when you are also taking money out, can do more damage than the same drop years later.
So many retirees embrace a reassuring rule: live on the income and leave the principal alone. Sensible? Sometimes. Simple? Hardly. We have all seen distribution rate claims of 15%, 20% or even 25% and wondered, “How is that possible?” The simple answer is that those numbers are not realistic as safe, dependable investment returns. An investment may pay out that much for a while, but the extra cash usually comes with extra risk, a falling share price, or the return of the investor’s own money. Think of it like taking money from your piggy bank and calling it an allowance: cash came out, but you did not become richer. “Income” may mean bond interest, stock dividends, option premiums, realized gains, or merely getting back a slice of your own money. A handsome payment can look like prosperity even while the portfolio beneath it is quietly shrinking.
The Strategy Shares Nasdaq 7HNDL Index ETF therefore emphasizes risk adjusted total return in addition to yield, because a holding that distributes 15% while declining 20% in value would have produced a negative total return despite its distribution. By contrast, a diversified portfolio may fund distributions from a combination of current income, realized gains and capital appreciation. This distinction is discussed in “A New Way to Income” concept paper published by HANDLS Indexes nearly a decade in 2018 when they created the Target Distribution Category.
Chasing yield is chasing risk
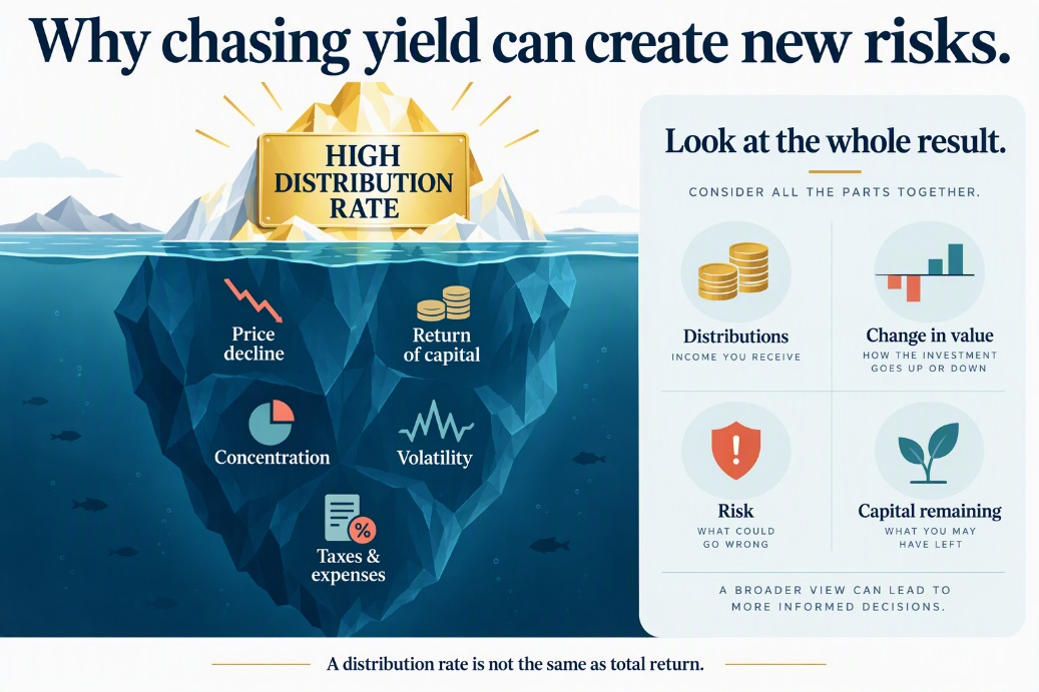 The income ETF aisle is crowded with promises of nosebleed levels of yield: higher yielding bonds, dividend stocks, preferred securities, real estate securities, covered call strategies, closed end funds and a constantly expanding shelf of ETFs. Each may have a place in a portfolio but the trouble begins when investors shop by one number alone: the fattest distribution rate.
Double-digit distributions may look impressive, but a high distribution is not the same as a high return. The cash must come from somewhere, and it will likely reduce the investment’s net asset value. What matters is not only how much is paid today, but also how much remains invested, how well that money can grow, and whether it can support future payments in an uncertain market.
A better question, then, is not “What pays the most today?” It is: How can a portfolio turn total return into cash flow without betting the retirement on a ton of risk, one asset class, or the manifestation of one magical market outcome? That is a portfolio design challenge, not a yield beauty contest.
Designing the distribution into the portfolio
The Strategy Shares Nasdaq 7HANDL™ Index ETF, ticker HNDL, seeks to provide a 7% annualized distribution rate, paid monthly, by tracking the Nasdaq 7HANDL Index. The index uses a diversified portfolio of ETFs spanning multiple asset classes rather than relying on a single asset class focused on income. The distribution rate is a target and is not a guarantee of investment return, income or principal preservation.
The machinery matters. Strategy Shares materials for the HNDL ETF describe a Core Portfolio paired with a tactical Explore Portfolio governed by Nasdaq Dorsey Wright, plus 23% structural leverage. The approach borrows from modern portfolio theory: diversify broadly to reduce the damage any single security or sector can inflict, then use limited amounts of leverage to seek enough total return to support the managed distribution after estimated expenses over the long term – your retirement. The original HANDLS white paper (published nearly a decade ago) lays out the blueprint in greater detail.
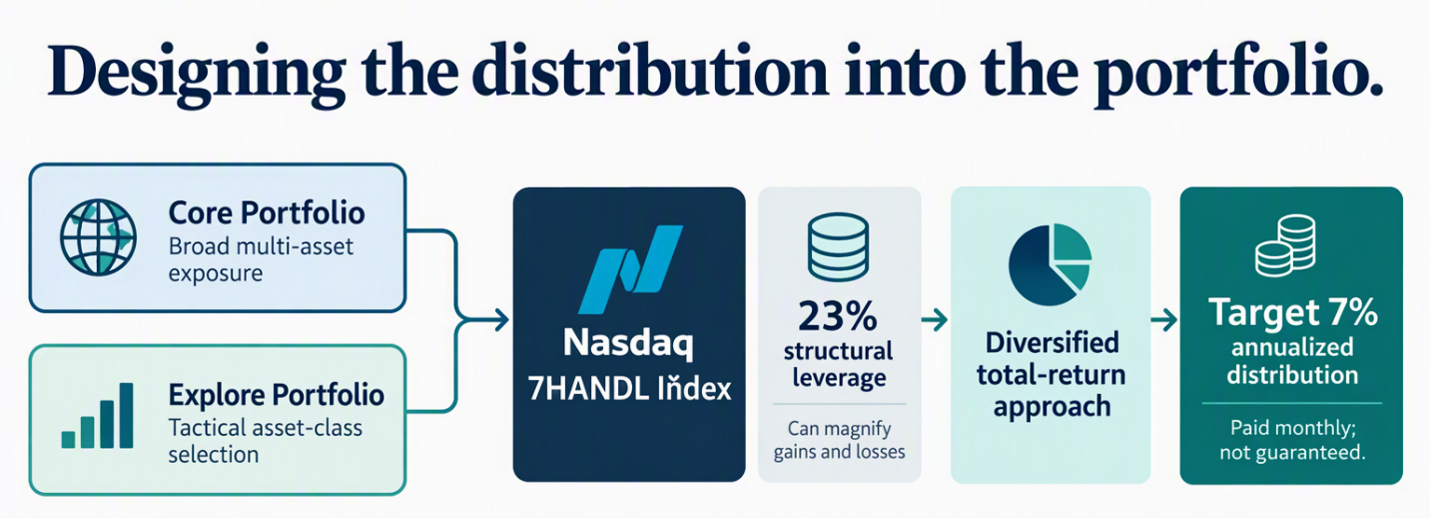
HANDLS combines fixed Core and tactical Explore allocations, structural leverage and a diversified total return approach in pursuit of a target annualized monthly distribution. The target distribution is not guaranteed and is calculated monthly as 1/12th of 7% of the fund’s monthly net assets.
None of this eliminates market risk. But diversification can improve risk-adjusted returns which is the metric that matters most when the future is unknowable and a portfolio must sustain you through retirement. Nobel laureate Harry Markowitz famously observed that diversification is the only free lunch in investing. Therefore, leverage is no free lunch; leverage can magnify losses just as readily as gains.
What makes HNDL different is that its income objective is engineered into the portfolio from the outset, rather than bolted onto a collection of unrelated, high-yield holdings after the fact. The result is an income strategy designed around the portfolio—not a portfolio assembled around the income. On $750,000, a 7% annualized target works out to $52,500 a year, or about $4,375 a month. An attractive paycheck, to be sure. But remember that is the distribution target, not an expected return, and certainly not a guarantee of performance.
Understand what the monthly payment represents
HNDL’s 7% is a target annualized distribution rate. It does not promise that the HNDL ETF will earn 7%, preserve principal or hold the distribution steady forever. ETF prices move. Markets disappoint. And part of a distribution may be return of capital.
The phrase “return of capital” deserves daylight, not fine print. It means some of the payment comes from shareholder equity rather than current portfolio income. As the HANDLS article “Return of Capital Can Enhance After-Tax Distributions” explains, the amount generally reduces an investor’s cost basis and may increase taxable gain when shares are eventually sold. In some cases, that can defer taxes and improve cash flow after taxes. In others, it can simply signal that capital is being consumed. The difference is consequential, and investors will want to consult with a qualified tax professional.
Income does not have to mean abandoning diversification
Retirement does not repeal inflation, and it does not put an expiration date on longevity. Someone leaving work at 65 may need a portfolio to keep working for 25 or 30 years or longer. That is why growth exposure can remain essential even after the paychecks stop.
The HNDL ETF’s underlying Nasdaq 7HANDL Index tackles that tension with diversified exposure to fixed income, equities and other assets, along with tactical selection by Nasdaq Dorsey Wright in the Explore component. Strategy Shares describes the HNDL ETF’s underlying index as a portfolio of ETFs designed to pursue monthly distributions while seeking to maintain a stable net asset value over time. Its overview of the 7HANDL approach returns to the central idea: risk adjusted total return is the well from which distributions ultimately must be drawn.
Put plainly, the mission is not “Find something that pays 7%.” It is “Build a diversified portfolio intended to support a 7% annualized managed distribution.” “Intended” is doing real work in that sentence. An index is a model governed by defined rules that guide a systematic process. Past performance predicts nothing. Investors cannot buy an index directly. Funds charge expenses, and the HNDL ETF’s results may not perfectly match the Nasdaq 7HANDL Index.
Give the portfolio a clearly defined job
There is no universal retirement income recipe. Age, spending, Social Security, pensions, taxes, risk tolerance, liquidity, time horizon and plans for heirs all go into the mix. So ask the question that too many investors skip: What job must this portfolio perform? If the answer is “maximize growth over the long term,” build a portfolio for growth. If the answer is “help deliver regular cash flow while retaining diversified market exposure,” the portfolio needs a different résumé and different tools.
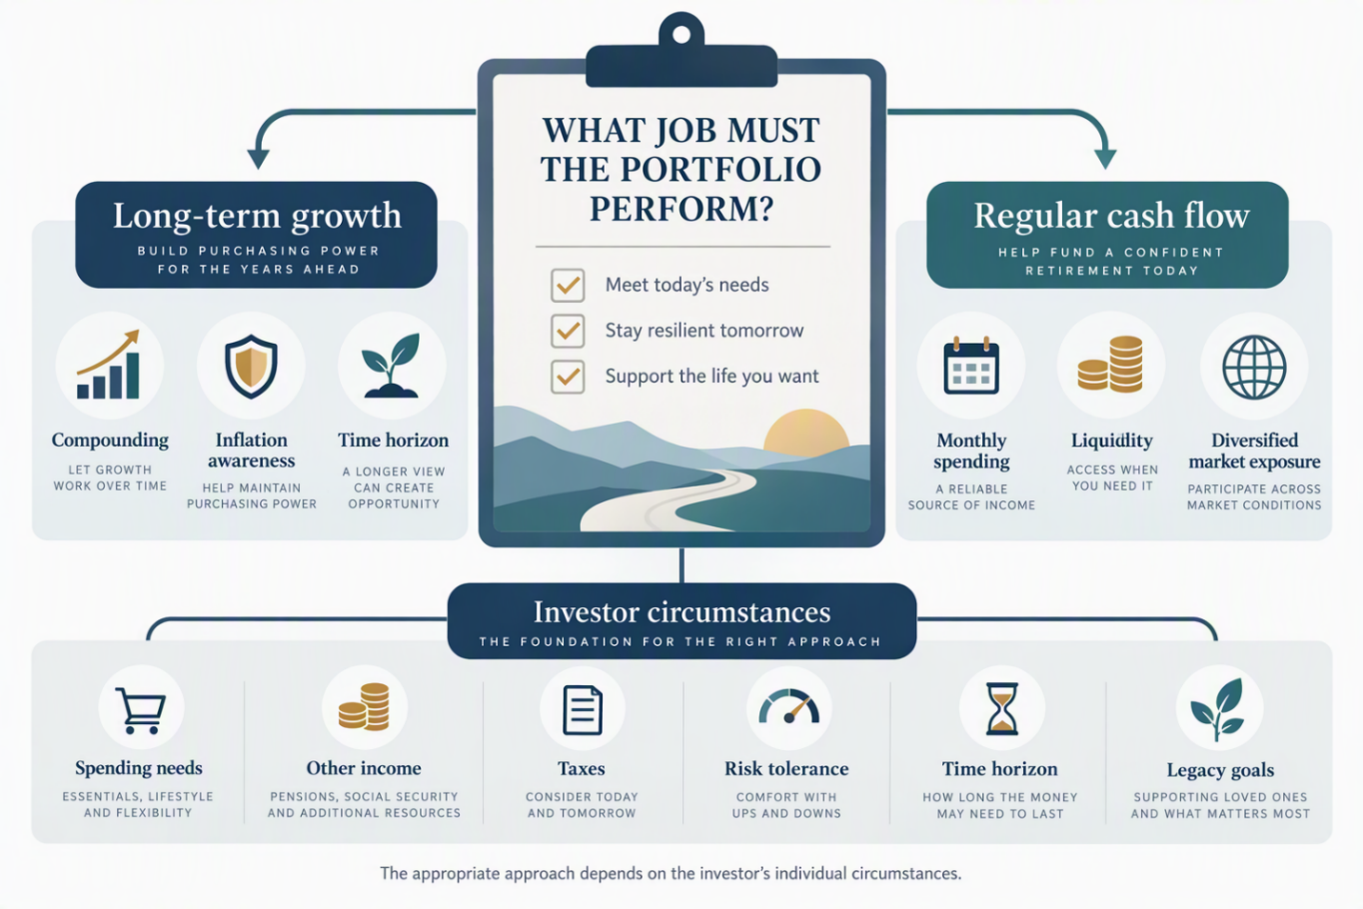
A portfolio’s appropriate role depends on the investor’s objectives and individual circumstances, not on a single headline measure.
The HNDL ETF offers one approach to organizing that retirement-income assignment. But it should be judged by more than its headline distribution rate—or the results of any single year. The real questions are whether the portfolio can generate attractive total returns, manage risk, control expenses, navigate tax considerations and fit within an investor’s broader retirement plan. In retirement, the paycheck matters. Just as important is the portfolio designed to produce it.
You worked hard to get your portfolio ready for retirement. Now make sure it knows what to do once you get there.
HNDL is not appropriate for all investors. The 7% figure represents a target annualized distribution rate and is not a guarantee of investment return or principal preservation. Distributions may include return of capital, which can reduce an investor’s tax basis and potentially increase taxable gain upon sale. Leverage may magnify gains and losses. Investment return and the value of ETF shares will fluctuate, and investors may receive less than their original investment when shares are sold. Investors should carefully review the HNDL ETF’s prospectus and consider its objectives, risks, charges and expenses before investing. HANDLS Indexes licenses its indexes to third parties and receives compensation in connection with those licenses.
The 30 Day SEC Yield as of 9/30/2026 is 2.72%.
The performance data quoted above represents past performance. Past performance is not a guarantee of future results. Investment return and value of the ETF shares will fluctuate so that an investor’s shares, when sold or redeemed, may be worth more or less than their original cost. Current performance may be lower or higher than performance data quoted.
For month-end and standardized HNDL performance https://strategysharesetfs.com/hndl/
For HNDL prospectus https://strategysharesetfs.com/funds/hndl/prospectus.pdf
NOTICE AND IMPORTANT DISCLOSURES:
The information provided in this article is for general informational purposes only and reflects general fund characteristics as of the time of this writing; it is not intended to provide personalized investment, tax, or financial advice. References to specific funds, securities, strategies, yields, distributions, performance, ratings, or characteristics are provided for educational purposes and should not be interpreted as a recommendation, solicitation, or endorsement of any investment product.
Investing involves risk, including the possible loss of principal. Income-focused strategies may involve tradeoffs, including reduced growth potential, market risk, interest-rate risk, credit risk, leverage risk, liquidity risk, and tax considerations. Distribution rates, fund yields, expense ratios, and investment strategies may change and should not be viewed as current, nor are any figures or returns guaranteed. Past performance, historical comparisons, and ratings are not indicative of future results.
Tax treatment varies based on individual circumstances and account type. Investors should consult their tax advisor regarding the tax implications of investment decisions. Before investing, individuals should carefully review a fund’s prospectus, objectives, risks, charges, expenses, and other important information, consider whether the investment aligns with their financial circumstances and goals, and consider speaking with a financial advisor about their specific situation.
The author, publisher, or affiliated parties may have relationships with certain investment products or issuers discussed in this article, including potential ownership interests, business relationships, or compensation arrangements. Any such relationships will be disclosed where applicable. Readers should consider this information when evaluating the discussion.
All or a portion of a distribution may consist of a return of capital. Shareholders should not assume that the source of a distribution from the Fund is net profit. Shareholders should note that return of capital will reduce the tax basis of their shares and potentially increase the taxable gain, if any, upon disposition of their shares.
Please click here to view the HNDL Prospectus: https://strategysharesetfs.com/funds/hndl/prospectus.pdf
There is no guarantee that this, or any investment strategy, will succeed. Shares of these ETFs are bought and sold at market price (not NAV) and are not individually redeemed from the ETF. Brokerage commissions will reduce returns.
Investment in a fund of funds is subject to the risks and expenses of the underlying funds. Diversification and asset allocation may not protect against market risk or loss of principal. Certain sectors and markets perform exceptionally well based on current market conditions and the Nasdaq 7HANDL ETF can benefit from that performance. Achieving such exceptional returns involves the risk of volatility and investors should not expect that such results will be repeated. The use of leverage can amplify the effects of market volatility on the fund’s share price and make the fund’s returns more volatile. The use of leverage may cause the fund to liquidate portfolio positions when it would not be advantageous to do so in order to satisfy its obligations. The use of leverage may also cause the fund to have higher expenses than those of funds that do not use such techniques.
HANDLS™ and HANDL™ are trademarks of Bryant Avenue Ventures LLC and have been licensed for use by Rational Advisors, Inc. Shareholders should not assume that the source of a distribution from the Fund is net profit. Shareholders should note that return of capital will reduce the tax basis of their shares and potentially increase the taxable gain, if any, upon disposition of their shares.
The Strategy Shares are distributed by Foreside Fund Services, LLC, which is not affiliated with Rational Advisors, Inc., or any of its affiliates.
Distribution Yield – Calculation NAV is the closing NAV prior to the Declaration Date that is used to calculate the 7.00% annualized target distribution.
30-day SEC Yield: Represents net investment income earned by a fund over a 30-day period, expressed as an annual percentage rate based on the fund’s share price at the end of the 30-day period. The 30-day yield should be regarded as an estimate of investment income and may not equal the fund’s actual income distribution rate.
30-day SEC Yield (unsubsidized): Unsubsidized yield does not adjust for any fee waivers and/or expense reimbursements.

About Strategy Shares
Strategy Shares is a family of exchange traded funds (ETFs) focused on bringing alternative strategies to the ETF marketplace. The firm strives to provide innovative strategies that support investors in meeting the challenges of an ever-changing global market environment. For more information on Strategy Shares and its various offerings, please visit: www.strategysharesetfs.com.
NOTICE:
The information provided in this article is for general informational purposes only and reflects general characteristics as of the time of this writing; it is not intended to provide personalized investment, tax, or financial advice, and should not be interpreted as a recommendation, solicitation, or endorsement of any investment product or tax strategy.
Tax treatment varies based on individual circumstances and account type. Investors should consult their tax advisor regarding the tax implications of investment decisions. Before investing, individuals should carefully review a fund’s prospectus, objectives, risks, charges, expenses, and other important information, consider whether the investment aligns with their financial circumstances and goals, and consider speaking with a financial advisor about their specific situation.
The author, publisher, or affiliated parties may have relationships with certain investment products or issuers discussed in this article, including potential ownership interests, business relationships, or compensation arrangements. Any such relationships will be disclosed where applicable. Readers should consider this information when evaluating the discussion.