
Since its inception in January 2018, the Strategy Shares Nasdaq 7HANDL™ Index ETF (HNDL) has delivered over 104 consecutive monthly distributions — through a global pandemic, the fastest rate-hike cycle in modern history, simultaneous stock-and-bond crashes, and every other market storm investors were told would break income strategies.
This is design, not chance.
It reflects deliberate engineering.
For those attuned to deeper patterns, 7 has long symbolized completion, cycles, and the quiet strength of steady flow.
Investors Don’t Spend Yield. They Spend Cash Flow.
Most “high-yield” products chase the biggest number on the label.
HNDL was built differently from day one.
Early research from HANDLS Indexes made one thing clear:
Sustainable income must be engineered, not improvised.
Instead of relying only on dividends or bond coupons, the Nasdaq 7HANDL™ Index generates income from total return — a disciplined mix of diversified assets, rules-based construction, and a clear monthly distribution policy.
The result?
A portfolio designed to answer the question almost every other income strategy quietly avoids:
How do you keep paying investors when markets refuse to cooperate?
The Old Playbook Is Broken
The classic 4% rule was never meant to maximize income.
It was designed to keep you from running out of money in the worst historical scenarios.
On a $1 million portfolio that means roughly $40,000 a year.
HNDL’s design targets approximately $70,000 a year — paid monthly.
That gap isn’t marketing.
It’s math. And over time, it compounds into real lifestyle difference.
How the Machine Works
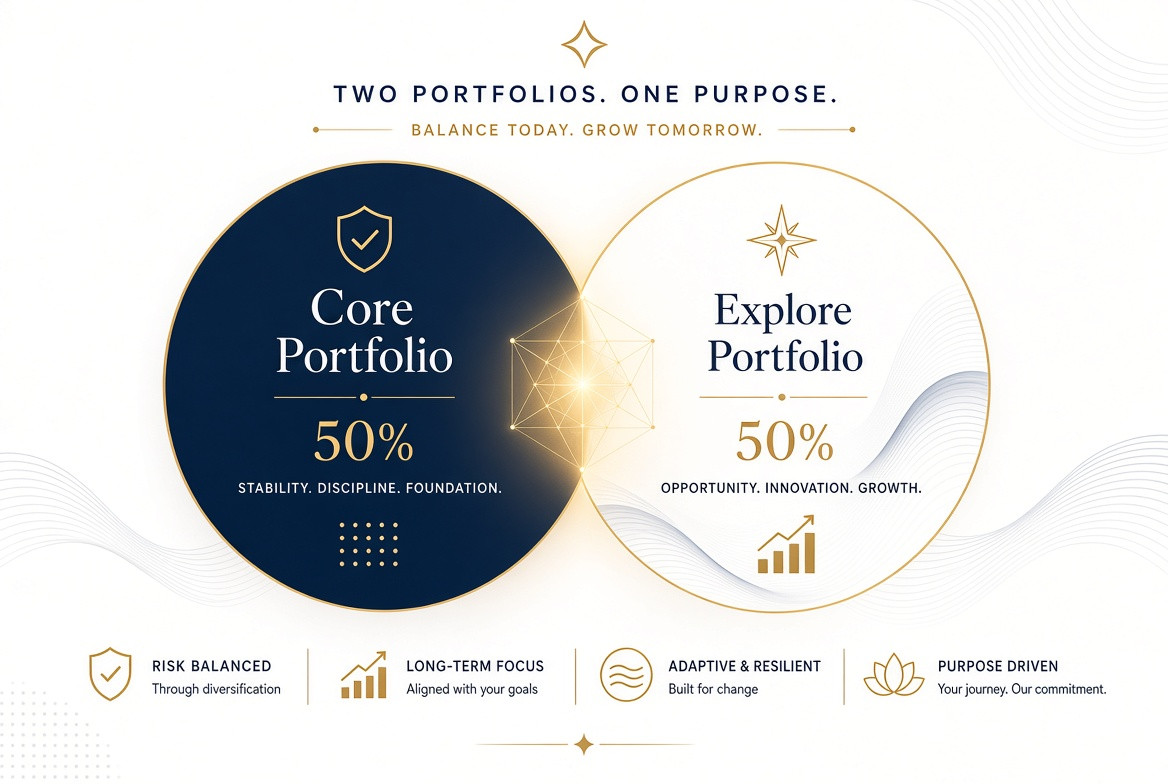
HNDL is a fund-of-funds ETF that tracks the Nasdaq 7HANDL™ Index. The index is built in two equal parts:
Core Portfolio (50%)
A diversified mix of equity and fixed-income ETFs that anchors the strategy and dampens volatility.
Explore Portfolio (50%)
Exposure across 12 different asset categories, dynamically tilted using relative-strength signals influenced by Dorsey Wright methodology.
Modest leverage of approximately 1.3x is used — not for speculation, but to help close the gap between market returns and the 7% annualized distribution target, paid every month.
Distributions are calculated from prior-period NAV and can include income, capital gains, and return of capital. This structure is what allows consistency across very different market regimes — a steady rhythm in a world that rarely offers one.
The Numbers Speak for Themselves
From February 2018 through September 2026:
-
104 consecutive monthly distributions
-
Monthly payouts that have generally stayed in a tight $0.12 – $0.15 per share range
-
Navigation through multiple interest-rate cycles, equity drawdowns, and one of the most aggressive tightening environments in decades
When you put the same starting capital side-by-side:
-
Traditional 4% rule → roughly $0.083 per month per $25 of NAV
-
HNDL historical cash flow → meaningfully higher, often 40–70% more on a pure cash-flow basis
On $1 million:
4% rule ≈ $40,000/year
HNDL target ≈ $70,000/year
This is not a promise of future results.
It is a design choice — and for anyone who actually spends portfolio income and wants to minimize asset erosion over time, design is everything.
The Hidden Superpower: Controlled Reset & Rebuild
Markets will draw down. That’s not optional.
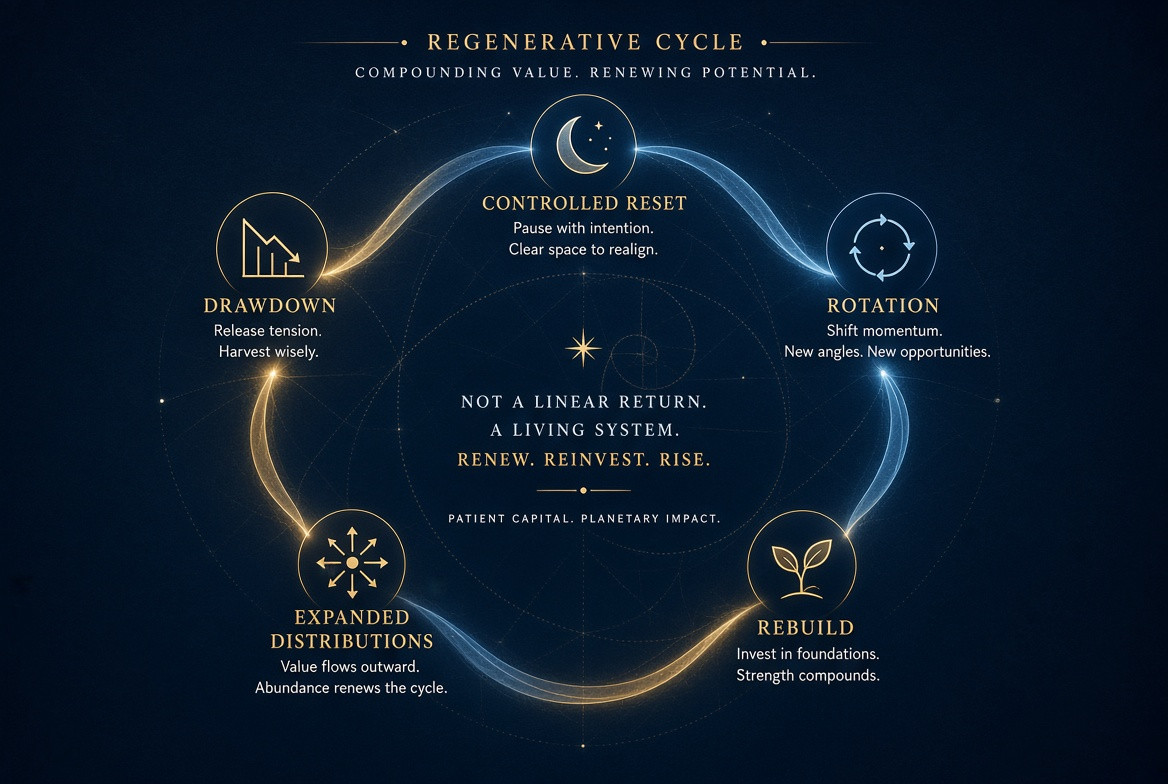
HNDL’s framework treats drawdowns as part of a repeatable cycle rather than a crisis:
-
NAV may decline and distributions can modestly adjust (real markets, real prices).
-
The dynamic Explore Portfolio — guided by relative-strength signals — systematically rotates toward stronger asset classes as leadership changes.
-
Equity participation rebuilds total return.
-
NAV recovers. Monthly distributions can expand again.
Volatility is not merely survived.
It is harnessed — a quiet, engineered rhythm of release and renewal.
This Is Not Another “High-Yield” Product
A high distribution rate is never free.
It usually comes with extra risk, lost upside, or return of your own capital.
HNDL is different by design:
-
Multiple asset classes instead of a single yield source
-
Rules-based allocation instead of hope
-
Managed distribution policy instead of chasing the highest number
The goal is monthly cash flow while keeping diversified market exposure.
Of course the strategy has risks: leverage, underlying fund expenses, market losses, and the possibility that distributions include return of capital (which reduces cost basis). A higher or steadier distribution does not by itself mean superior total return, lower risk, or principal protection.
Smart investors look at the full picture — total return, NAV path, distribution sources, expenses, leverage, and taxes.
Beyond the 4% Rule
The 4% rule asks:
“How little can I safely take?”
HNDL asks a different question:
“How can I responsibly take more — and still sleep at night?”
After 104 consecutive monthly distributions across some of the most turbulent markets in decades, HNDL makes a powerful case:
Distribution stability is not the enemy of discipline.
It can be the result of it.
For those who feel the quiet power of consistent cycles, the number 7 has always spoken of completion and flow.
For everyone else, the cash simply arrives every month.
Ready to See the Full Picture?
Explore the Strategy Shares Nasdaq 7HANDL™ Index ETF (HNDL)
→ View current distributions, holdings, and performance
→ Download the prospectus
→ Talk to your advisor about whether this engineered approach belongs in your portfolio
Because cash flow that shows up every month is the kind of income that actually pays the bills.
Important Disclosures
1 Consecutive distributions do not indicate investment performance, preservation of principal, or the likelihood of future distributions.
2 Illustration assumes a $1,000,000 portfolio. Monthly distribution amounts are calculated by applying the stated annual distribution rate (4% or 7%) to $1,000,000 and dividing by 12.
3 Cooley, Philip L., Carl M. Hubbard, and Daniel T. Walz. “Retirement Savings: Choosing a Withdrawal Rate That Is Sustainable.” Journal of the American Association of Individual Investors, February 1998; updated analyses published 2011.
NOTICE AND IMPORTANT DISCLOSURES:
The information provided in this article is for general informational purposes only and reflects general fund characteristics as of the time of this writing; it is not intended to provide personalized investment, tax, or financial advice. References to specific funds, securities, strategies, yields, distributions, performance, ratings, or characteristics are provided for educational purposes and should not be interpreted as a recommendation, solicitation, or endorsement of any investment product.
Investing involves risk, including the possible loss of principal. Income-focused strategies may involve tradeoffs, including reduced growth potential, market risk, interest-rate risk, credit risk, leverage risk, liquidity risk, and tax considerations. Distribution rates, fund yields, expense ratios, and investment strategies may change and should not be viewed as current, nor are any figures or returns guaranteed. Past performance, historical comparisons, and ratings are not indicative of future results.
Tax treatment varies based on individual circumstances and account type. Investors should consult their tax advisor regarding the tax implications of investment decisions. Before investing, individuals should carefully review a fund’s prospectus, objectives, risks, charges, expenses, and other important information, consider whether the investment aligns with their financial circumstances and goals, and consider speaking with a financial advisor about their specific situation.
The author, publisher, or affiliated parties may have relationships with certain investment products or issuers discussed in this article, including potential ownership interests, business relationships, or compensation arrangements. Any such relationships will be disclosed where applicable. Readers should consider this information when evaluating the discussion.
All or a portion of a distribution may consist of a return of capital. Shareholders should not assume that the source of a distribution from the Fund is net profit. Shareholders should note that return of capital will reduce the tax basis of their shares and potentially increase the taxable gain, if any, upon disposition of their shares.
Please click here to view the HNDL Prospectus: https://strategysharesetfs.com/funds/hndl/prospectus.pdf
For more complete information on Strategy Shares, download and view a prospectus or summary prospectus now or call (855) 477-3837 for a free prospectus or summary prospectus. You should consider the fund’s investment objectives, risks, charges, and expenses carefully before you invest. Information about these and other important subjects is in the fund’s prospectus or summary prospectus, which you should read carefully before investing. Investing involves risk, including loss of principal.
There is no guarantee that this, or any investment strategy, will succeed. Shares of these ETFs are bought and sold at market price (not NAV) and are not individually redeemed from the ETF. Brokerage commissions will reduce returns.
Investment in a fund of funds is subject to the risks and expenses of the underlying funds. Diversification and asset allocation may not protect against market risk or loss of principal. Certain sectors and markets perform exceptionally well based on current market conditions and the Nasdaq 7HANDL ETF can benefit from that performance. Achieving such exceptional returns involves the risk of volatility and investors should not expect that such results will be repeated. The use of leverage can amplify the effects of market volatility on the fund’s share price and make the fund’s returns more volatile. The use of leverage may cause the fund to liquidate portfolio positions when it would not be advantageous to do so in order to satisfy its obligations. The use of leverage may also cause the fund to have higher expenses than those of funds that do not use such techniques.
HANDLS™ and HANDL™ are trademarks of Bryant Avenue Ventures LLC and have been licensed for use by Rational Advisors, Inc. Shareholders should not assume that the source of a distribution from the Fund is net profit. Shareholders should note that return of capital will reduce the tax basis of their shares and potentially increase the taxable gain, if any, upon disposition of their shares.
The Strategy Shares are distributed by Foreside Fund Services, LLC, which is not affiliated with Rational Advisors, Inc., or any of its affiliates.
Distribution Yield – Calculation NAV is the closing NAV prior to the Declaration Date that is used to calculate the 7.00% annualized target distribution.
30-day SEC Yield: Represents net investment income earned by a fund over a 30-day period, expressed as an annual percentage rate based on the fund’s share price at the end of the 30-day period. The 30-day yield should be regarded as an estimate of investment income and may not equal the fund’s actual income distribution rate.
30-day SEC Yield (unsubsidized): Unsubsidized yield does not adjust for any fee waivers and/or expense reimbursements.
The 30 Day SEC Yield as of 9/30/2026 is 2.72%.
The performance data quoted above represents past performance. Past performance is not a guarantee of future results. Investment return and value of the ETF shares will fluctuate so that an investor’s shares, when sold or redeemed, may be worth more or less than their original cost. Current performance may be lower or higher than performance data quoted.
For standardized HNDL performance https://strategysharesetfs.com/hndl/
For HNDL prospectus https://strategysharesetfs.com/funds/hndl/prospectus.pdf