At 65, you can expect to live another 19.7 years on average.
That’s 20 more years of life — or, roughly 240 consecutive monthly payments for everything from housing to groceries without a paycheck coming in to foot the bill. That’s the reality for roughly 11,400 Americans who reach retirement age every day, and it will be the reality for most of us. In a way, it’s a problem that a monthly dividend ETF is well placed to solve.
Few, however, solve the problem well.
What $1 Million Could Actually Pay
A million-dollar retirement portfolio, as an example, could generate either $1,667 or $5,833 each month.
That’s the same investment pool, but two completely different retirements. The difference lies in whether that million-dollar portfolio is put to work at a 2% yield—or a 7% distribution rate.
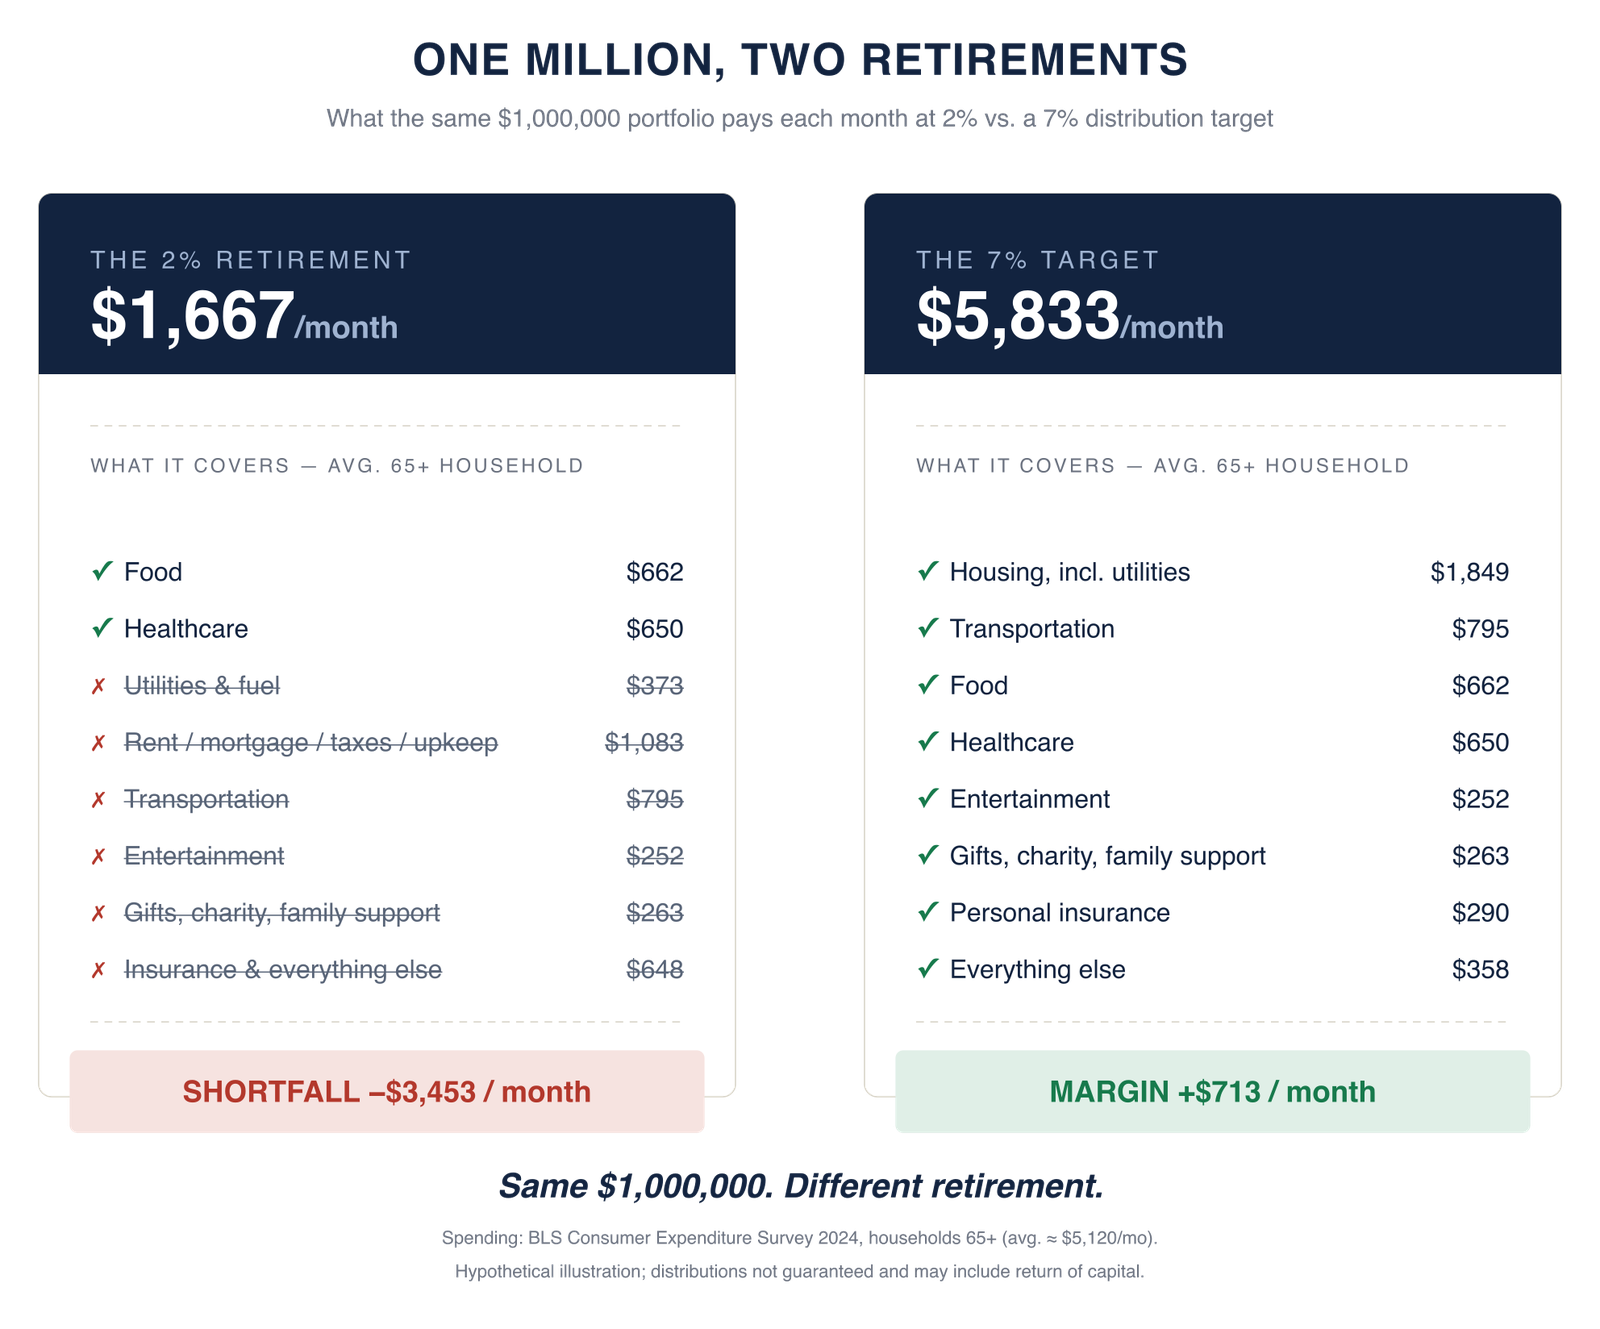
Illustration assumes a $1,000,000 portfolio. Monthly distribution amounts are calculated by applying the stated annual distribution rate (2% or 7%) to $1,000,000 and dividing by 12. Estimated monthly expenses of $5,120 represent average household expenditures for households age 65 and older, based on the source data noted, and are provided for illustrative purposes only. Actual household income, expenses and retirement needs will vary. The shortfall or margin represents the difference between the illustrated monthly distribution and estimated monthly expenses. Figures may not sum due to rounding. Not the result of an actual investment.
Traditionally, the advice was to let a bond-heavy portfolio do all the work as retirement approached and to withdraw four percent each year. However, bonds are under historic stress right now. In August, inflation re-accelerated to 3.4% and, more recently on September 16th, the Federal Reserve hiked interest rates for the first time in 3 years. All this, against a background of a global sell-off in US treasuries. At the moment, the advice to put all your eggs — or retirement savings — into long-term government bonds feels like it belongs to a completely different era.
We believe a retirement portfolio built for this era requires three things; high current income, an investment engine that can outrun inflation, and diversification so you don’t solely depend on bond returns. We would argue that it is these three criteria — rather than a headline yield figure — that separate the best monthly dividend ETFs and the best retirement ETFs from the rest.
What Actually Survives a Retirement?
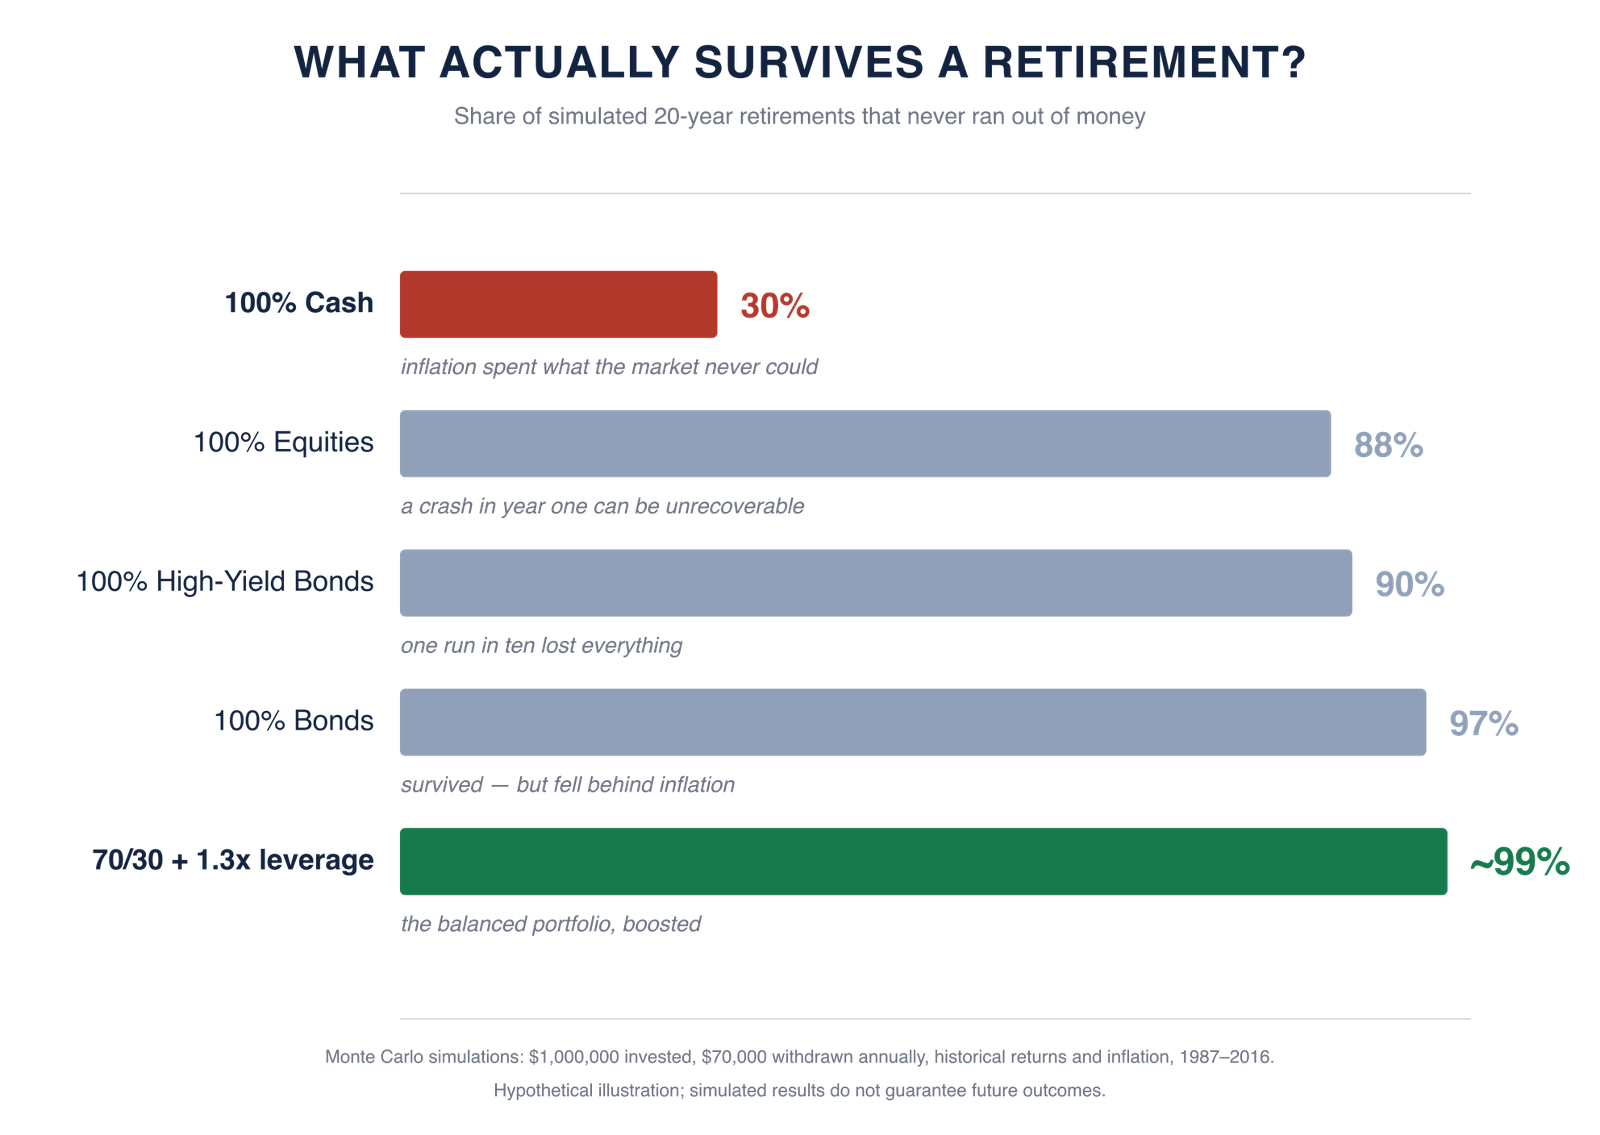
Using thousands of randomized market sequences built from real returns between 1987 and 2016, we modeled a million-dollar portfolio where $70,000 is withdrawn each year for 20 years against historical inflation. Here’s how different retirement portfolios fared — with survival meaning that the retirement accounts never ran out of money, paying every $70,000 withdrawal:
-
30% of 100% cash portfolios survived
-
88% of 100% stock portfolios survived
-
90% of 100% high-yield bond portfolios survived
-
99% of 70/30 portfolios with modest 1.3x leverage survived
According to the data, a balanced investment strategy paired with a modest, controlled boost, earns roughly 2.26 percentage points more per year than the high-yield approach (at similar market volatility), which is similar to how the Strategy Shares Nasdaq 7HANDL™ Index ETF (HNDL) operates. It’s an income ETF designed to seek investment results that correlate, generally, before fees and expenses, to the price and yield performance of the NASDAQ 7HANDL Index. In our view, this Fund serve as a complete retirement ETF, providing exposure to nearly 20,000 underlying securities. The Fund is split into two components:
-
Two engines working side by side. The Fund has a 50% allocation to fixed income and equity ETFs (the “Core Portfolio”) and a 50% allocation to a Dorsey Wright Explore Portfolio, which is a tactical allocation within U.S. fixed income, U.S. blend, U.S. equity, and U.S. alternative assets (or categories that have historically provided high levels of income.
-
Modest leverage at 1.3x exposure. The goal of the Index is to represent an allocation to a balanced portfolio of U.S. equities, fixed income securities and alternative 2 investments, then employ leverage in an amount equal to 23% of the total portfolio (measured as a percent of the combined base of the portfolio plus the leverage amount.
-
Cost discipline. The Core Fixed Income Sleeve weighting allocates to the three U.S. aggregate bond ETFs with the lowest expense ratios after waivers and 0.95% total fees for a levered, multi-asset portfolio with a rules-based tactical sleeve.
HNDL has made 102 consecutive monthly distributions since inception in January 2018, outlasting a pandemic and two rate-hiking cycles.
As for HNDL’s record against its benchmark — the Bloomberg U.S. Aggregate Bond Index – the table below shows why we believe retirees should consider HNDL (through June 30, 2026):
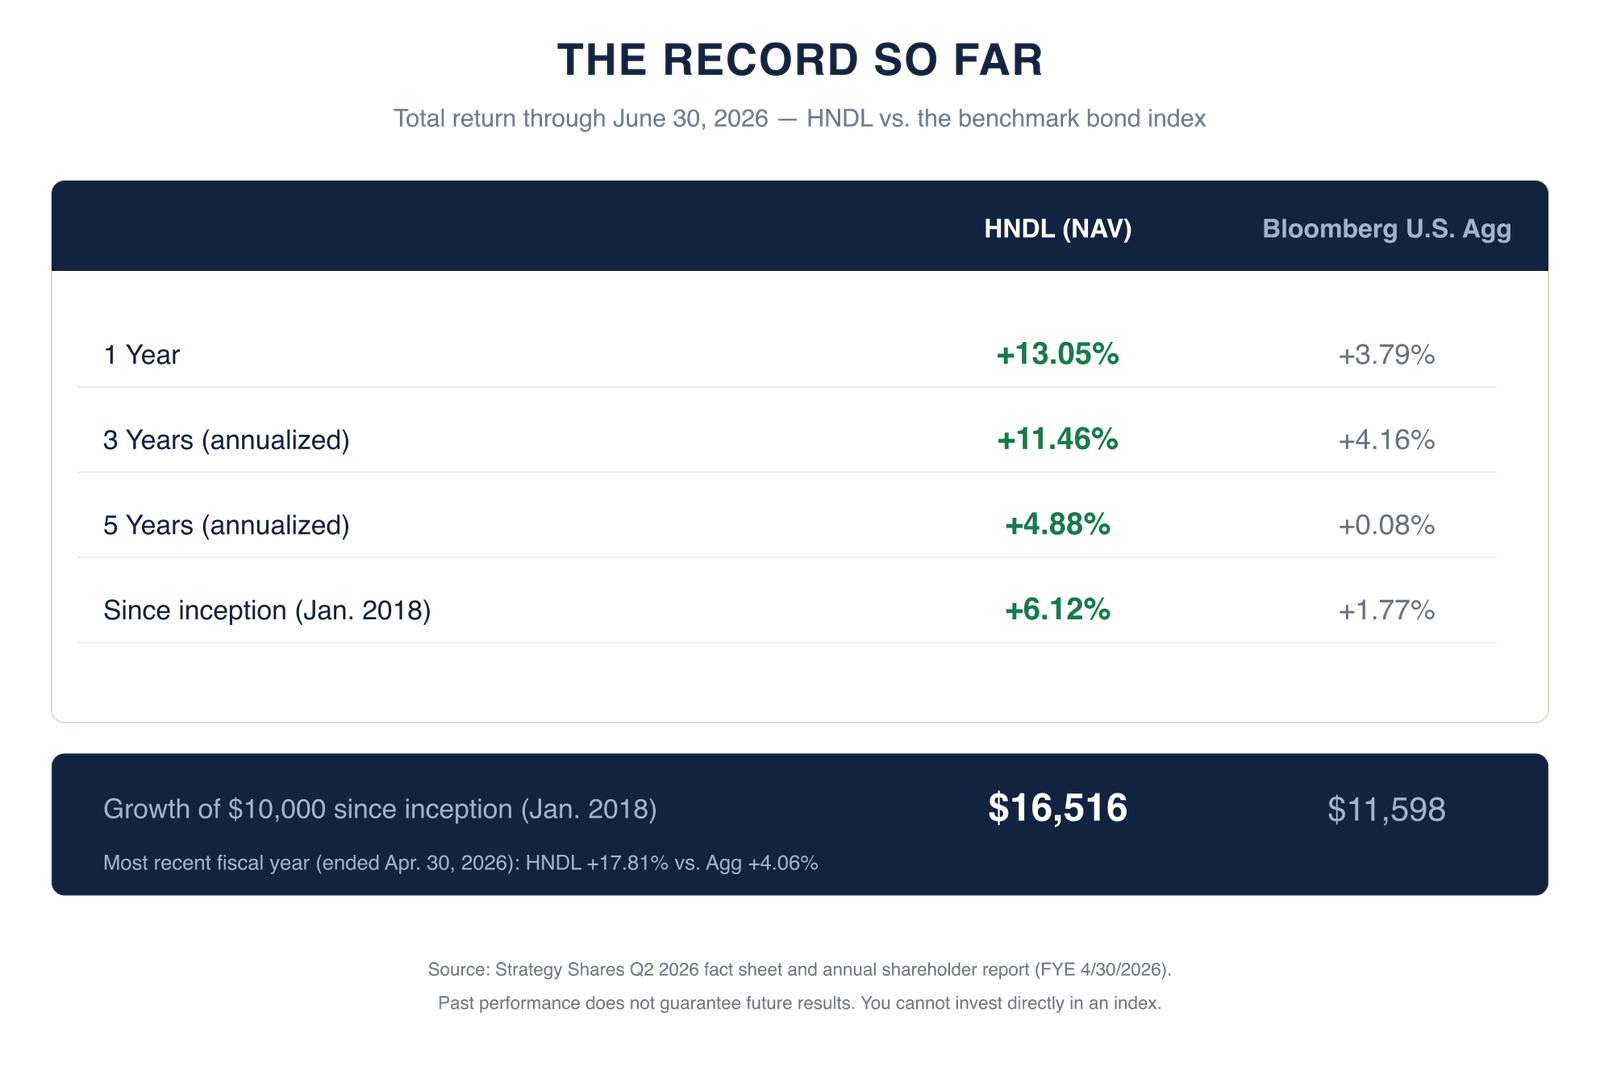
The performance data quoted above represents past performance. Past performance is not a guarantee of future results. Investment return and value of the ETF shares will fluctuate so that an investor’s shares, when sold or redeemed, may be worth more or less than their original cost. Current performance may be lower or higher than performance data quoted. For standardized performance https://strategysharesetfs.com/hndl/
A hypothetical $10,000 invested at inception into HNDL would be valued at $16,516 today versus $11,598 if invested in the bond index. In the most recent fiscal year, HNDL provided its investors with returns of +17.81% versus the +4.06% returns of its benchmark index.
This follows three consecutive calendar years (2023-2025) of double-digit returns.
Frequently Asked Questions
Does the 4% rule still work for retirement?
The 4% rule was built for a different bond era and assumes scheduled selling, which can prove painful in downturns. A managed-distribution approach aims to provide income without forcing asset sales.
Do ETFs really pay you every month?
Some ETFs do. HNDL has paid 102 consecutive months since January 2018.
Are ETFs good for retirement income?
It is our opinion that the best retirement ETFs are ones that deliver on the needs of retirement. Those ETFs will be ones that provide income and diversification at low cost while also minimizing risk.
Is a 7% distribution the same as a 7% return?
Distribution is cash paid out. Return is what the portfolio earns. Managed payouts can include return of capital — generally not taxed as current income, reducing your cost basis.
What makes a good monthly dividend ETF?
We believe that beyond high income, look for an ETF that can provide a potential growth engine, cost discipline, and diversification that doesn’t completely depend on government bonds.
NOTICE AND IMPORTANT DISCLOSURES:
The information provided in this article is for general informational purposes only and reflects general fund characteristics as of the time of this writing; it is not intended to provide personalized investment, tax, or financial advice. References to specific funds, securities, strategies, yields, distributions, performance, ratings, or characteristics are provided for educational purposes and should not be interpreted as a recommendation, solicitation, or endorsement of any investment product.
Investing involves risk, including the possible loss of principal. Income-focused strategies may involve tradeoffs, including reduced growth potential, market risk, interest-rate risk, credit risk, leverage risk, liquidity risk, and tax considerations. Distribution rates, fund yields, expense ratios, and investment strategies may change and should not be viewed as current, nor are any figures or returns guaranteed. Past performance, historical comparisons, and ratings are not indicative of future results.
Tax treatment varies based on individual circumstances and account type. Investors should consult their tax advisor regarding the tax implications of investment decisions. Before investing, individuals should carefully review a fund’s prospectus, objectives, risks, charges, expenses, and other important information, consider whether the investment aligns with their financial circumstances and goals, and consider speaking with a financial advisor about their specific situation.
The author, publisher, or affiliated parties may have relationships with certain investment products or issuers discussed in this article, including potential ownership interests, business relationships, or compensation arrangements. Any such relationships will be disclosed where applicable. Readers should consider this information when evaluating the discussion.
All or a portion of a distribution may consist of a return of capital. Shareholders should not assume that the source of a distribution from the Fund is net profit. Shareholders should note that return of capital will reduce the tax basis of their shares and potentially increase the taxable gain, if any, upon disposition of their shares.
Please click here to view the HNDL Prospectus: https://strategysharesetfs.com/funds/hndl/prospectus.pdf
For more complete information on Strategy Shares, download and view a prospectus or summary prospectus now or call (855) 477-3837 for a free prospectus or summary prospectus. You should consider the fund’s investment objectives, risks, charges, and expenses carefully before you invest. Information about these and other important subjects is in the fund’s prospectus or summary prospectus, which you should read carefully before investing. Investing involves risk, including loss of principal.
There is no guarantee that this, or any investment strategy, will succeed. Shares of these ETFs are bought and sold at market price (not NAV) and are not individually redeemed from the ETF. Brokerage commissions will reduce returns.
Investment in a fund of funds is subject to the risks and expenses of the underlying funds. Diversification and asset allocation may not protect against market risk or loss of principal. Certain sectors and markets perform exceptionally well based on current market conditions and the Nasdaq 7HANDL ETF can benefit from that performance. Achieving such exceptional returns involves the risk of volatility and investors should not expect that such results will be repeated. The use of leverage can amplify the effects of market volatility on the fund’s share price and make the fund’s returns more volatile. The use of leverage may cause the fund to liquidate portfolio positions when it would not be advantageous to do so in order to satisfy its obligations. The use of leverage may also cause the fund to have higher expenses than those of funds that do not use such techniques.
HANDLS™ and HANDL™ are trademarks of Bryant Avenue Ventures LLC and have been licensed for use by Rational Advisors, Inc. Shareholders should not assume that the source of a distribution from the Fund is net profit. Shareholders should note that return of capital will reduce the tax basis of their shares and potentially increase the taxable gain, if any, upon disposition of their shares.
The Strategy Shares are distributed by Foreside Fund Services, LLC, which is not affiliated with Rational Advisors, Inc., or any of its affiliates.
Distribution Yield – Calculation NAV is the closing NAV prior to the Declaration Date that is used to calculate the 7.00% annualized target distribution.
30-day SEC Yield: Represents net investment income earned by a fund over a 30-day period, expressed as an annual percentage rate based on the fund’s share price at the end of the 30-day period. The 30-day yield should be regarded as an estimate of investment income and may not equal the fund’s actual income distribution rate.
30-day SEC Yield (unsubsidized): Unsubsidized yield does not adjust for any fee waivers and/or expense reimbursements.